Plotly图在RMarkdown文档的for循环中无法呈现。

17

我正在尝试动态构建一个报告,需要运行循环,并在每次迭代中打印一些消息、表格和图表。除了图表之外,我可以让所有东西都正常工作。

example.rmd

```{r echo=FALSE, results='asis', fig.keep='all', message = FALSE, warning = FALSE}
library(knitr)
library(plotly)

for(i in 1:4){
  foo <- iris[sample(nrow(iris), 20), ]

  cat("\n")
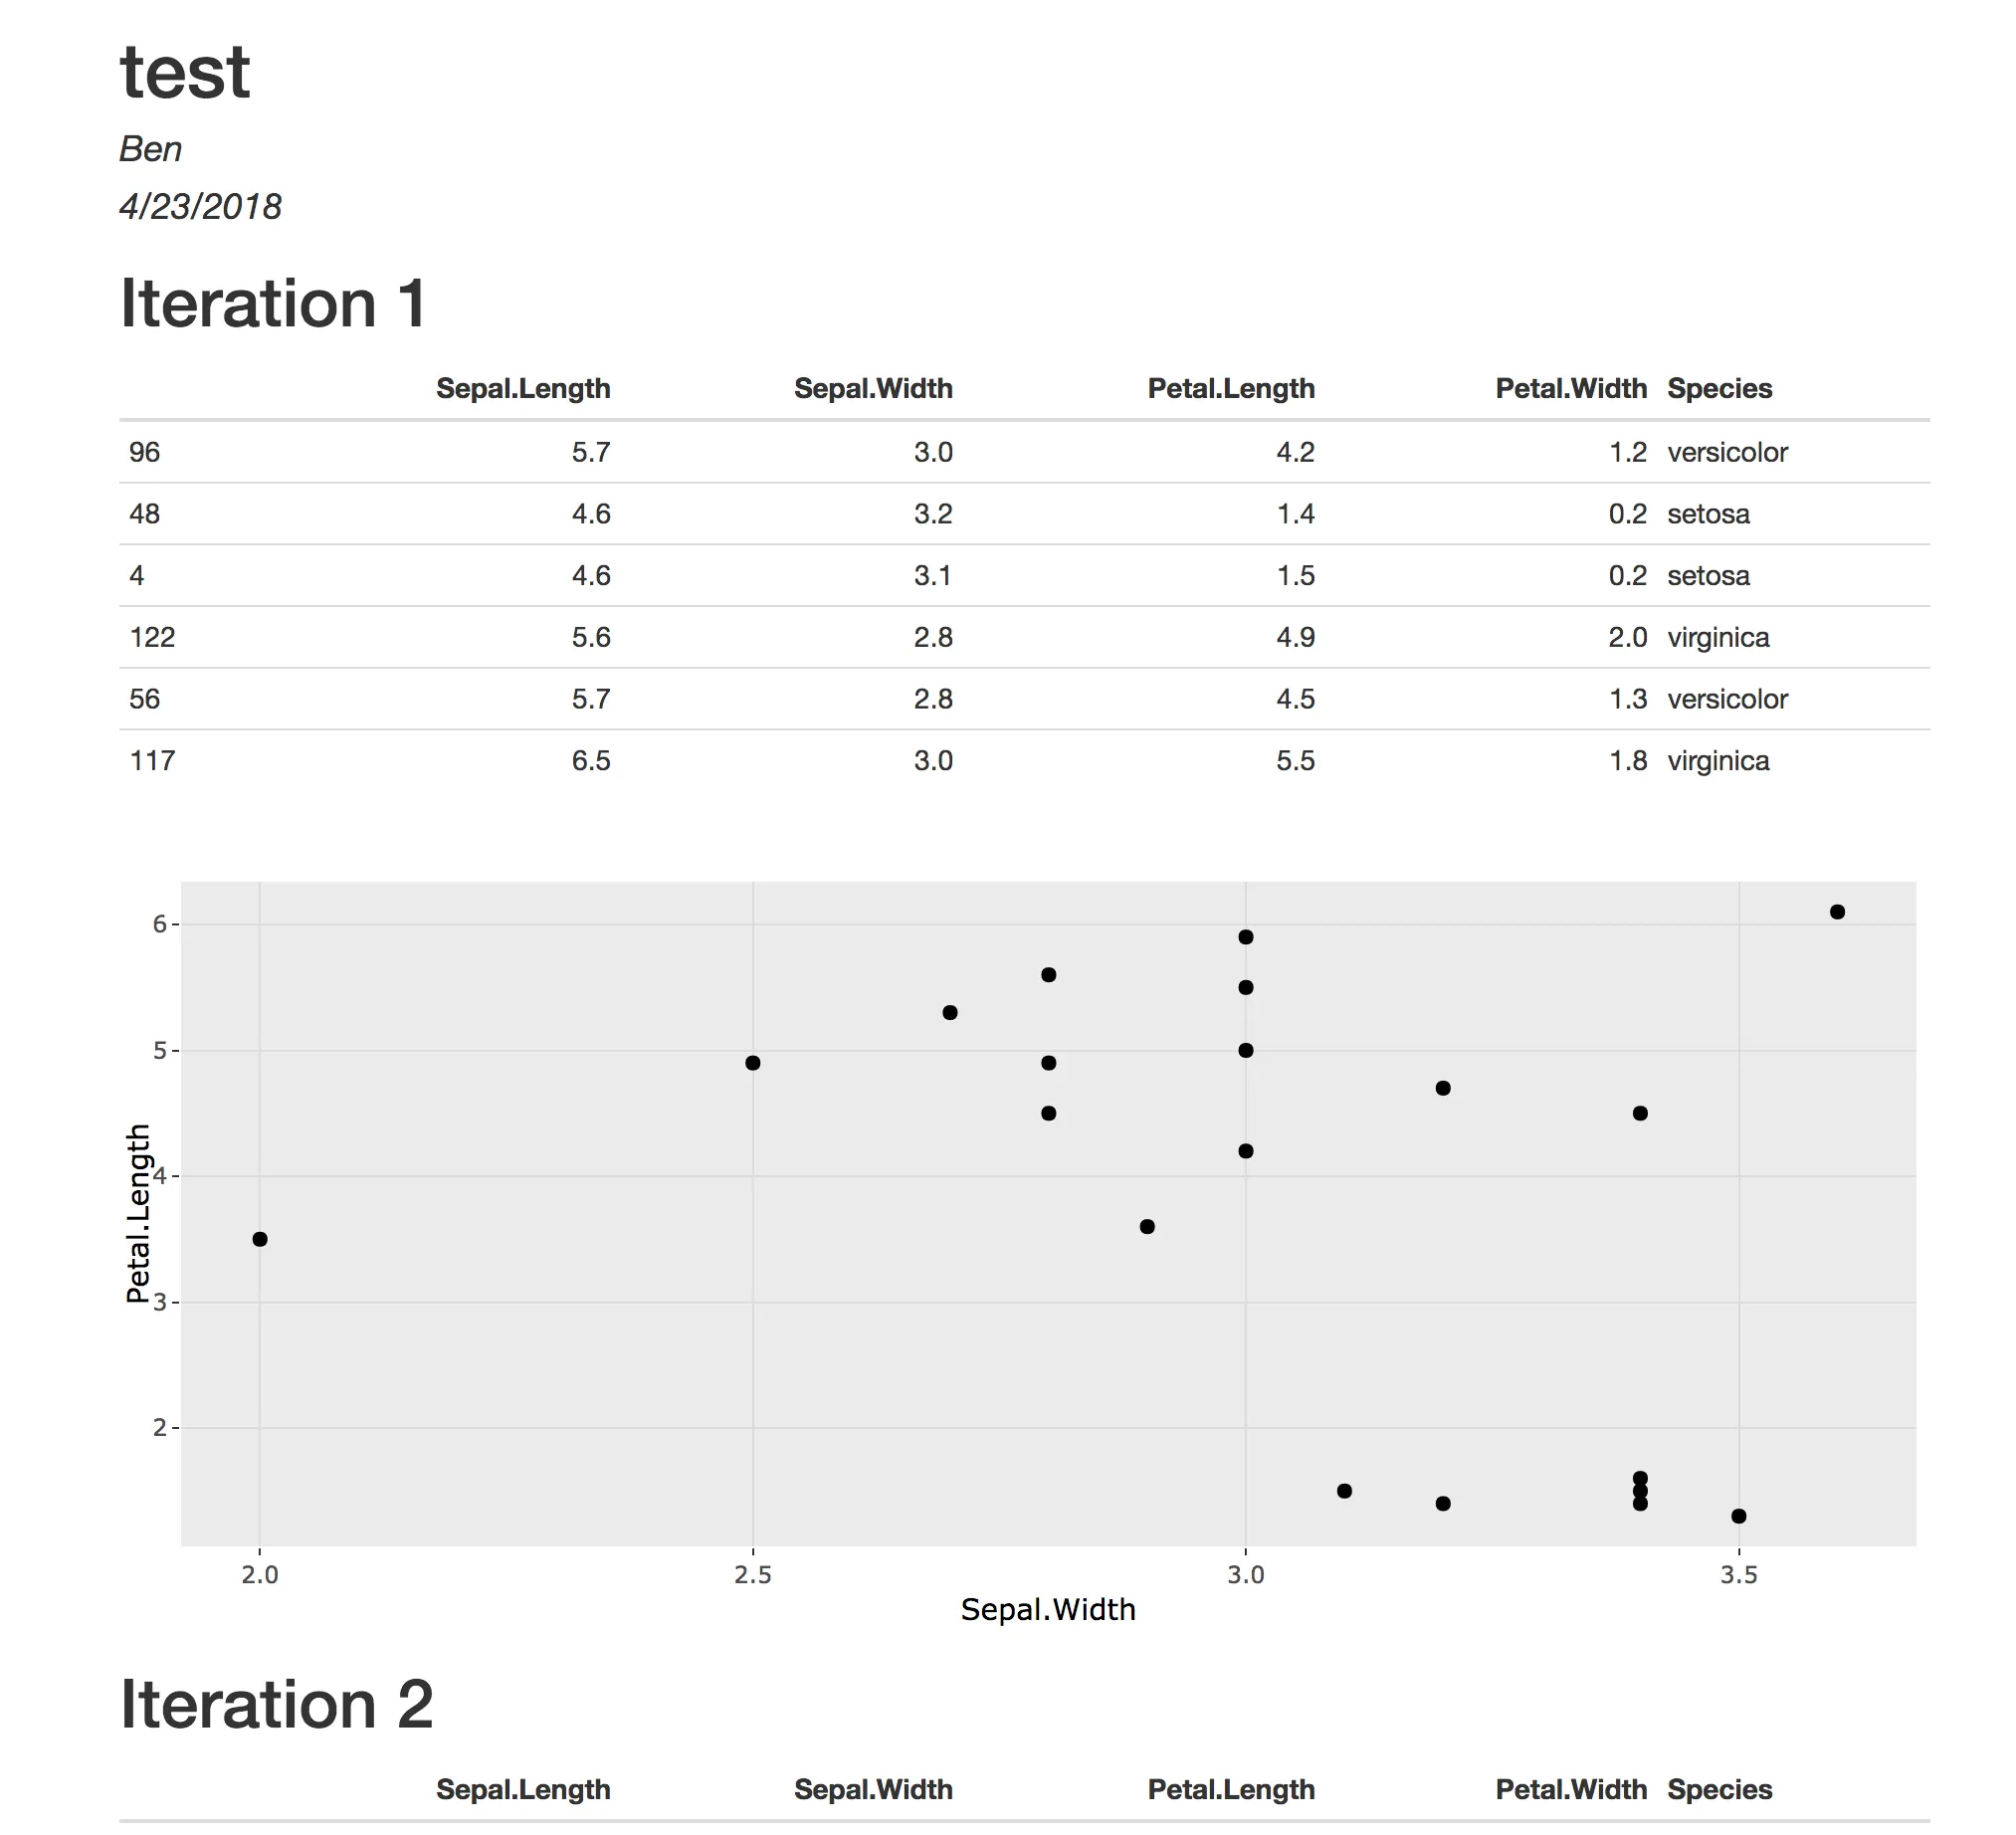
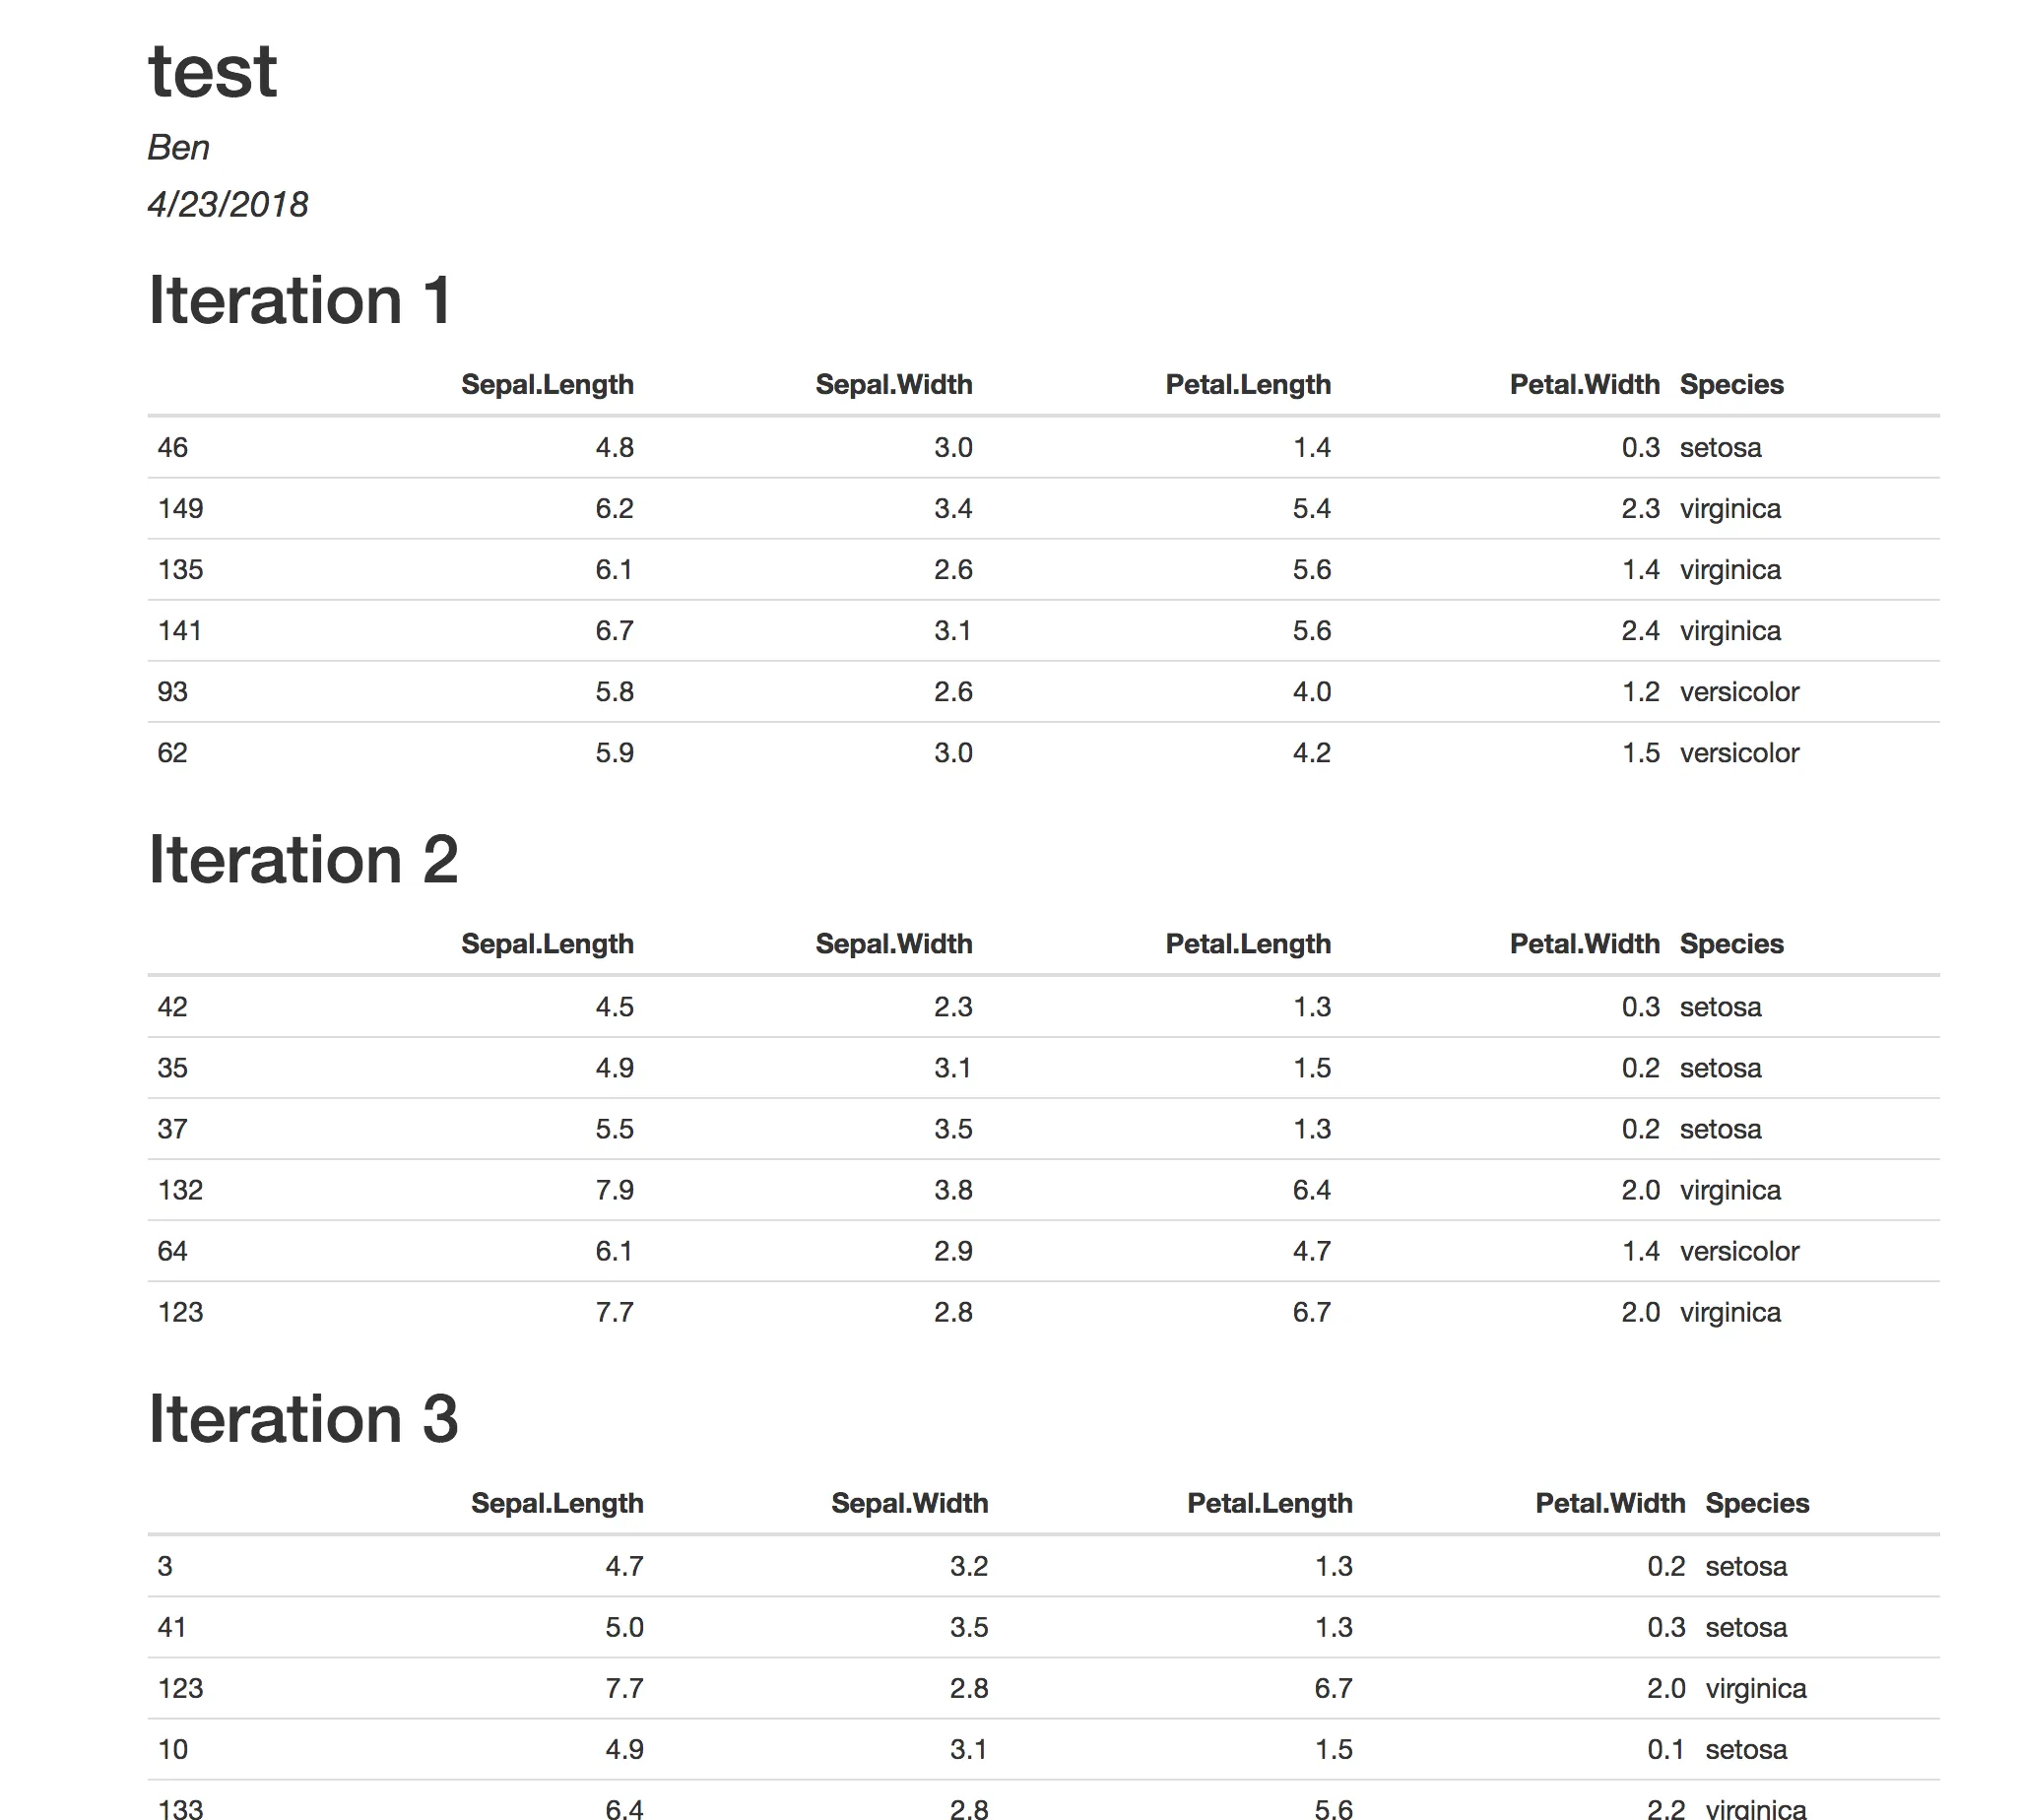
  cat("# Iteration", i, "\n")

  # Print the first few lines
  print(kable(head(foo)))
  cat("\n")

  # Plot Sepal.Width vs Petal.Length using ggplotly()
  plt <- ggplot(foo, aes(x = Sepal.Width, y = Petal.Length))+geom_point()

  # plot(plt)  # <- this works
  # plot(ggplotly(plt))  # <- this doesn't work
  # ggplotly(plt)  # <- this doesn't work

  cat("\n")
}
```

在此输入图片描述

我该如何让Plotly的图表在我的报告中呈现?


我最近在 shiny 应用程序中渲染 rmarkdown 文档时也遇到了这个问题,但我还没有找到解决方案。 - Kevin Arseneau
1个回答

19

参照Github上的这篇文章解决了基本相同的问题,我想找到更好的方法,但目前使用了一种比较hacky的解决方案。

```{r echo=FALSE, results='asis', fig.keep='all', message = FALSE, warning = FALSE}
library(knitr)
library(plotly)

# Build list of outputs
output <- list()
for(i in 1:4){
  foo <- iris[sample(nrow(iris), 20), ]

  # Header for iteration
  txt <- paste0("#Iteration ", i)
  output[[length(output) + 1L]] <- txt

  # Table of the first few lines
  tbl <- kable(head(foo))
  output[[length(output) + 1L]] <- tbl

  # Plot
  plt <- ggplotly(ggplot(foo, aes(x = Sepal.Width, y = Petal.Length))+geom_point())
  output[[length(output) + 1L]] <- plt
}

# Render the outputs
for(j in 1:length(output)){
  x <- output[[j]]

  if(inherits(x, "character")){
    cat("\n")
    cat(x)
  } else if(inherits(x, "knitr_kable")){
    cat("\n")
    print(x)
  }
  else {
    # print the html piece of the htmlwidgets
    cat("\n")
    cat(htmltools::renderTags(as.widget(x))$html)
  }
}
```

```{r echo=FALSE, messages=FALSE, warning=FALSE}
# Attach the Dependencies since they do not get included with renderTags(...)$html
deps <- lapply(
  Filter(f = function(x){inherits(x,"htmlwidget")}, x = output),
  function(hw){
    htmltools::renderTags(hw)$dependencies
  }
)
htmltools::attachDependencies(x = htmltools::tagList(), value = unlist(deps,recursive=FALSE))
```

在此输入图片描述


4
你分享的 Github 问题链接非常有帮助。在 Yihui 在 htmlwidgets这个 PR 中解释之前,我无法轻易地理解解决方案。 - Kevin Arseneau
有没有想过如何在timevis图中实现它?而不是使用plotly htmlwidget?我用这种方法取得了有限的成功。 - mdb_ftl

网页内容由stack overflow 提供, 点击上面的
可以查看英文原文,
原文链接