我希望能够在循环中绘制多条图形而不会覆盖所有先前的图形。
在此2015年的文章中,提出了在循环内添加图形的解决方案,即在plot_ly或add_trace函数中设置
在此2015年的文章中,提出了在循环内添加图形的解决方案,即在plot_ly或add_trace函数中设置
evaluate = TRUE。但是,截至2017年,在更新的版本plot_ly中,evaluate不是一个属性。'scatter3d' objects don't have these attributes: 'evaluate'
这个问题和这个问题都无法解决此问题。此文章承认evaluate=TRUE在新版本的Plotly中不起作用,但没有提供解决方法。有什么新的解决方案吗?
我要复制/粘贴的数据:
structure(list(x_1 = c(74.651438, 75.31493, 76.736865, 77.858125,
79.347856, 80.302483), y_1 = c(249.063605, 247.149121, 245.461889,
243.811041, 242.382685, 240.300034), z_1 = c(4.373868, 3.653744,
4.101455, 4.134471, 4.225507, 4.890157), x_2 = c(85.468712, 86.637469,
87.993127, 87.907308, 88.748766, 89.680155), y_2 = c(249.063405,
247.145423, 245.46148, 244.949469, 244.005001, 242.917665), z_2 = c(4.56633,
4.059976, 3.842906, 4.019021, 4.316799, 4.378894), x_3 = c(101.720648,
101.70598, 102.022836, 102.166059, 102.242424, 102.317043), y_3 = c(249.660075,
249.562464, 249.771452, 249.619983, 249.39349, 249.444531), z_3 = c(3.080686,
3.003508, 2.774651, 2.291644, 2.239727, 1.932501)), .Names = c("x_1",
"y_1", "z_1", "x_2", "y_2", "z_2", "x_3", "y_3", "z_3"), row.names = c(NA,
6L), class = "data.frame")
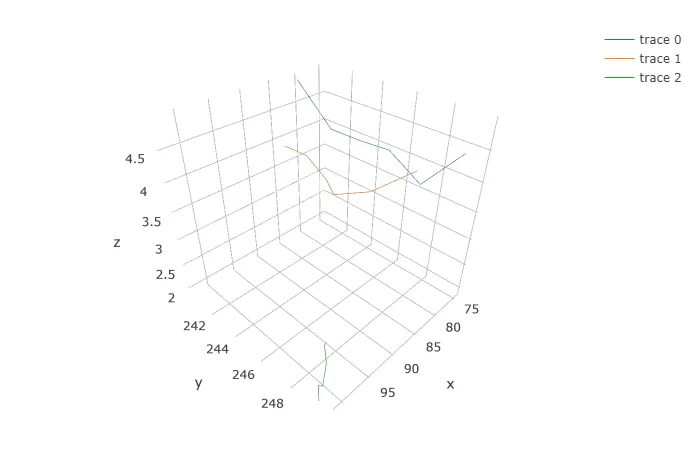
我的代码:
library(plotly)
p <- plot_ly(temp, type = 'scatter3d', mode = 'lines', width = 1)
for(i in 1:3){
  x = paste0("x_",i)
  y = paste0("y_",i)
  z = paste0("z_",i)
  p <- add_trace(p, x = ~get(x), y = ~get(y), z = ~get(z))
}

p