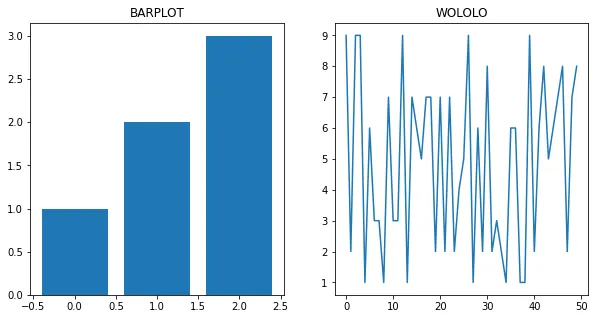
使用 Matplotlib 我可以做到这一点:
import numpy as np
import matplotlib.pyplot as plt

fig, axs = plt.subplots(1, 2, figsize=(10, 5))
fig.patch.set_facecolor('white')

axs[0].bar(x=[0,1,2], height=[1,2,3])
axs[1].plot(np.random.randint(1, 10, 50))

axs[0].set_title('BARPLOT')
axs[1].set_title('WOLOLO')
使用Plotly,我只知道一种方法来设置子图标题——在创建时:fig = make_subplots(rows=1, cols=2, subplot_titles=('title1', 'title2'))
是否可以在创建后设置子图标题?
也许可以通过获取基于Matplotlib的原始Axes类(我读到plotly.python基于Seaborn,Seaborn基于Matplotlib)来实现?
或者通过fig.layout实现?
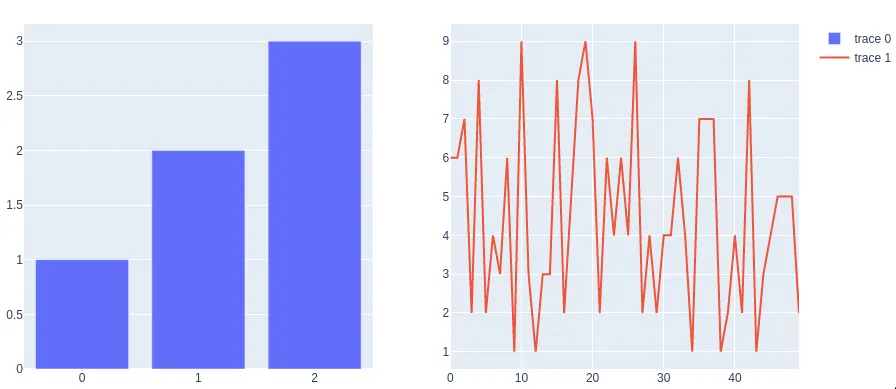
请使用以下代码:
import numpy as np
import plotly.graph_objects as go
from plotly.subplots import make_subplots

fig = make_subplots(rows=1, cols=2)
fig.add_trace(go.Bar(y=[1, 2, 3]), row=1, col=1)
fig.add_trace(go.Scatter(y=np.random.randint(1, 10, 50)), row=1, col=2)