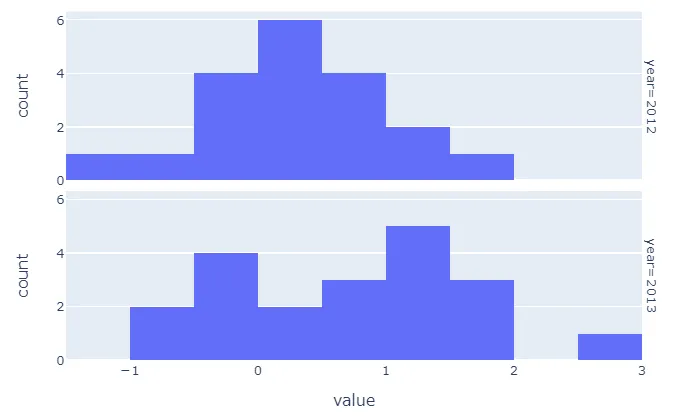
我试图编写一个for循环,用于distplot子图。我有一个数据框具有许多不同长度的列。(不包括NaN值)
我想在不同的子图中绘制每个分布。谢谢。
fig = make_subplots(
    rows=len(assets), cols=1,
    y_title = 'Hourly Price Distribution')

i=1
for col in df_all.columns:
    fig = ff.create_distplot([[df_all[[col]].dropna()]], col)
    fig.append()
    i+=1
fig.show()
我试图为distplots运行一个子图的for循环,但出现了以下错误:
PlotlyError:糟糕!您的数据列表或ndarrays应该具有相同的长度。
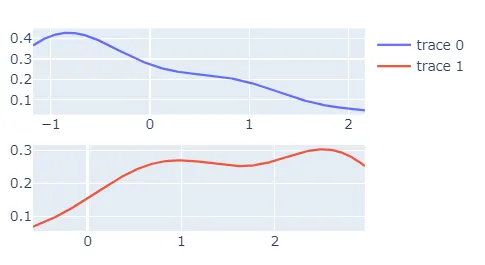
更新: 下面是一个示例:
df = pd.DataFrame({'2012': np.random.randn(20),
           '2013': np.random.randn(20)+1})
df['2012'].iloc[0] = np.nan
fig = ff.create_distplot([df[c].dropna() for c in df.columns],
df.columns,show_hist=False,show_rug=False)
fig.show()
我想在不同的子图中绘制每个分布。谢谢。