我正在尝试创建一个类似于Plotly create_distplot的图形,但是我想将线条样式更改为虚线。查看该函数时,我发现他们说该函数已被弃用,建议我改用plotly.express函数。
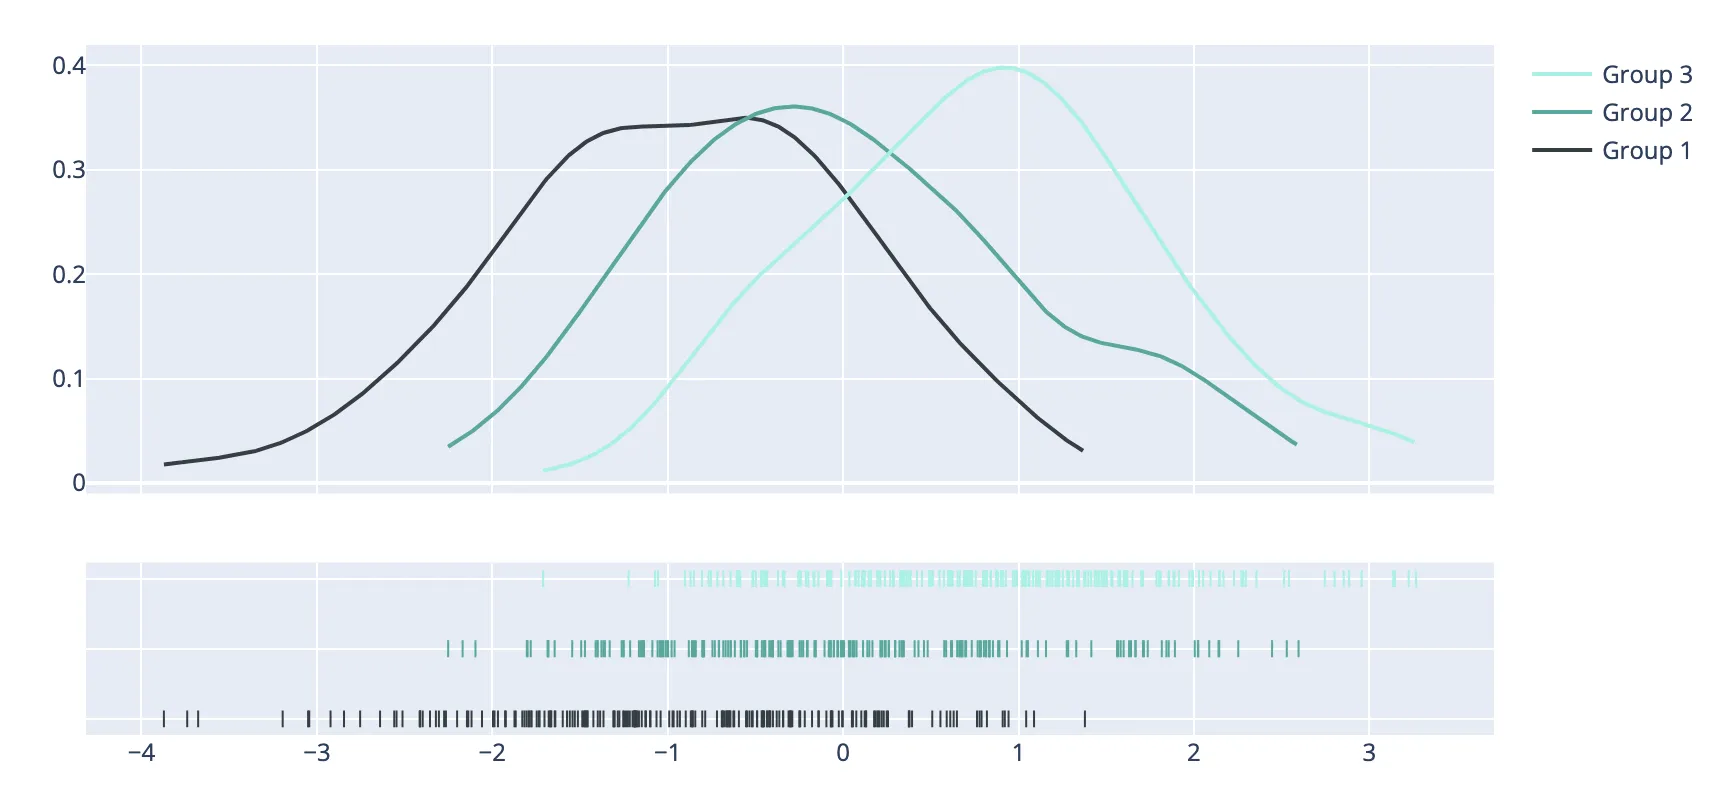
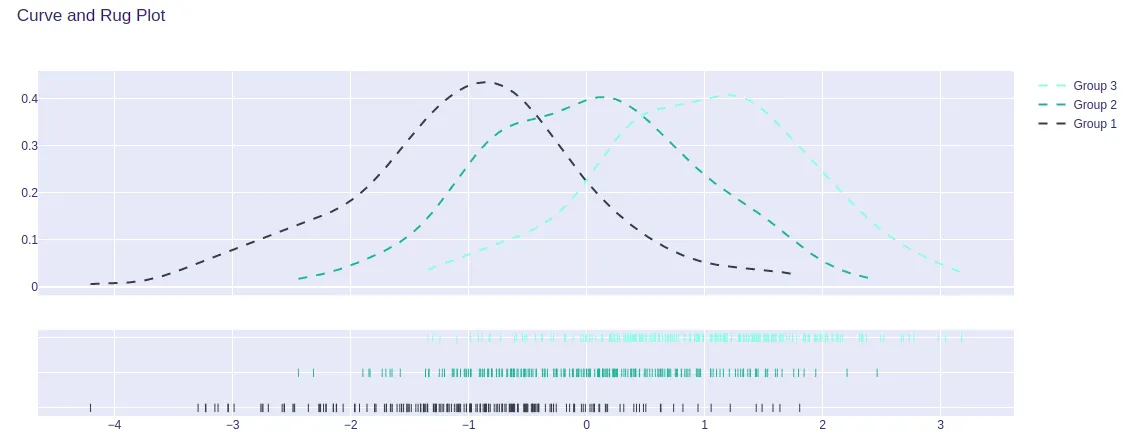
然而,我在plotly.express示例中找不到任何类似于distplot的创建方法。所有在plotly网站上的示例仍在使用create_distplot。我可以使用已弃用的函数,但我想调整线条样式为虚线,我没有看到任何更改线条设置的方法,只有颜色。具体来说,我想获取直方图数据并创建线和地毯图,其中线显示分布曲线,就像下面的示例一样。请问有人能帮助我在plotly.express中找出如何执行此操作,或者至少如何更改distplot的线条样式吗?
这是我正在使用的plotly参考链接。 https://plotly.com/python/distplot/#basic-distplot
**this function is deprecated**, use instead :mod:`plotly.express` functions
然而,我在plotly.express示例中找不到任何类似于distplot的创建方法。所有在plotly网站上的示例仍在使用create_distplot。我可以使用已弃用的函数,但我想调整线条样式为虚线,我没有看到任何更改线条设置的方法,只有颜色。具体来说,我想获取直方图数据并创建线和地毯图,其中线显示分布曲线,就像下面的示例一样。请问有人能帮助我在plotly.express中找出如何执行此操作,或者至少如何更改distplot的线条样式吗?
这是我正在使用的plotly参考链接。 https://plotly.com/python/distplot/#basic-distplot
import plotly.figure_factory as ff
import numpy as np

x1 = np.random.randn(200) - 1
x2 = np.random.randn(200)
x3 = np.random.randn(200) + 1

hist_data = [x1, x2, x3]

group_labels = ['Group 1', 'Group 2', 'Group 3']
colors = ['#333F44', '#37AA9C', '#94F3E4']

# Create distplot with curve_type set to 'normal'
fig = ff.create_distplot(hist_data, group_labels, show_hist=False, colors=colors)

# Add title
fig.update_layout(title_text='Curve and Rug Plot')
fig.show()