在调试或计算密集的循环中,我希望能够看到我的数据处理如何演变(例如在一条折线图或图像中)。
在 matplotlib 中,可以使用 plt.cla() 然后使用 plt.draw() 或 plt.pause(0.001) 来重新绘制 / 更新图形,这样我就可以实时跟踪计算进度或进行调试。在 plotly express(或 plotly)中如何做到呢?
在调试或计算密集的循环中,我希望能够看到我的数据处理如何演变(例如在一条折线图或图像中)。
在 matplotlib 中,可以使用 plt.cla() 然后使用 plt.draw() 或 plt.pause(0.001) 来重新绘制 / 更新图形,这样我就可以实时跟踪计算进度或进行调试。在 plotly express(或 plotly)中如何做到呢?
我想我基本上弄清楚了。诀窍在于不使用go.Figure()创建图形,而是使用go.FigureWidget(),它在视觉上看起来相同,但在幕后并非如此。
这些 FigureWidgets 正好可以被更新,以便随着新数据的出现进行更新。 它们保持动态,并且稍后的调用可以修改它们。
可以从一个 Figure 创建一个 FigureWidget:
figure = go.Figure(data=data, layout=layout)

f2 = go.FigureWidget(figure)
f2                                          #display the figure
from google.colab import output; output.enable_custom_widget_manager() - Neil Traftfor i, col in enumerate(fig.data):
fig.data[i]['y'] = df[df.columns[i]]
fig.data[i]['x'] = df.index
无论使用 plotly.express 还是 go.Figure ,都不应该影响您的图形,因为这两种方法都会产生可以通过上面的代码片段进行编辑的图形结构。您可以通过在JupyterLab中设置以下两个片段来测试此功能。
import pandas as pd
import numpy as np
import plotly.express as px
import plotly.graph_objects as go
from jupyter_dash import JupyterDash
import dash_core_components as dcc
import dash_html_components as html
from dash.dependencies import Input, Output
# code and plot setup
# settings
pd.options.plotting.backend = "plotly"
# sample dataframe of a wide format
np.random.seed(5); cols = list('abc')
X = np.random.randn(50,len(cols))
df=pd.DataFrame(X, columns=cols)
df.iloc[0]=0;df=df.cumsum()
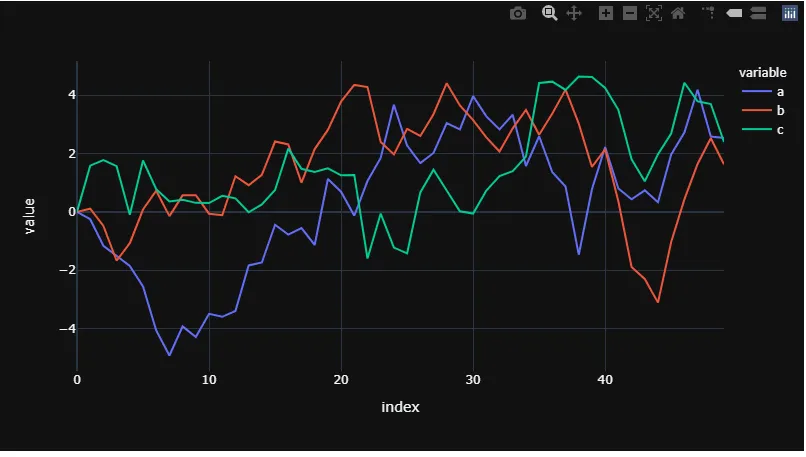
# plotly figure
fig = df.plot(template = 'plotly_dark')
fig.show()
# create or retrieve new data
Y = np.random.randn(1,len(cols))
# organize new data in a df
df2 = pd.DataFrame(Y, columns = cols)
# add last row to df to new values
# this step can be skipped if your real world
# data is not a cumulative process like
# in this example
df2.iloc[-1] = df2.iloc[-1] + df.iloc[-1]
# append new data to existing df
df = df.append(df2, ignore_index=True)#.reset_index()
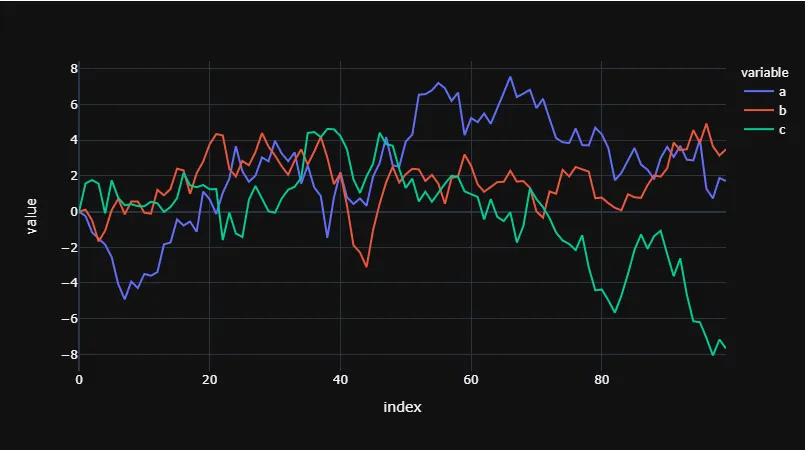
# replace old data in fig with new data
for i, col in enumerate(fig.data):
    fig.data[i]['y'] = df[df.columns[i]]
    fig.data[i]['x'] = df.index
fig.show()