使用Plotly Express创建基于国家区域的Choropleth图表

5

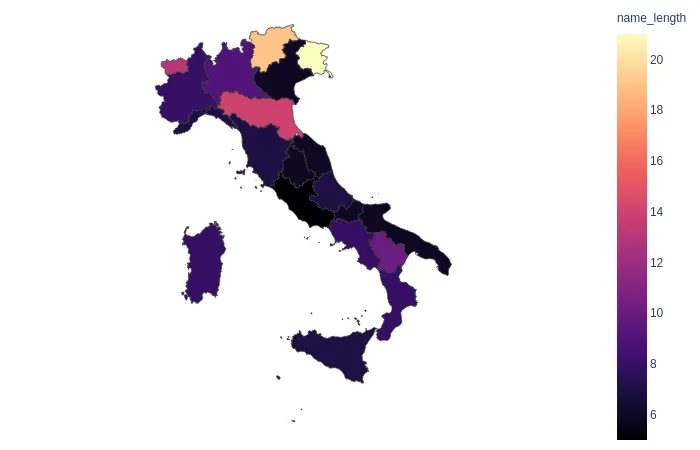
我有一个数据帧,创建于一个关于意大利新冠病毒在各个地区传播的CSV文件中。我试图创建一个px.choropleth图表,用于显示意大利每个地区的总阳性值。

以下是尝试的代码:

italy_regions=[i for i in region['Region'].unique()]
fig = px.choropleth(italy_last, locations="Country",
                    locationmode=italy_regions,
                    color=np.log(italy_last["TotalPositive"]), 
                    hover_name="Region", hover_data=['TotalPositive'],
                    color_continuous_scale="Sunsetdark", 
                    title='Regions with Positive Cases')
fig.update(layout_coloraxis_showscale=False)
fig.show()

现在我报告一些信息:'Country'是给我的数据框架起的名字,只填充了相同的值:'Italy'。如果我只输入'location="Country"', 那么这张地图就很好,我可以看到意大利被染成世界地图的颜色。当我尝试让pyplot把我的区域染上颜色时,问题就出现了。由于我是pyplot express的新手,所以我阅读了一些示例,并认为我需要创建一个意大利地区名称列表,然后将其作为'barmode'的输入放入'choropleth'中。显然我错了。那么,如何操作才能使其运行(如果有必要的话)?如果需要,我可以提供csv文件和我正在使用的jupyter文件。
1个回答

8
你需要提供一个包含意大利地区边界的geojson文件作为plotly.express.choropleth函数的参数,例如这个文件。

https://gist.githubusercontent.com/datajournalism-it/48e29e7c87dca7eb1d29/raw/2636aeef92ba0770a073424853f37690064eb0ea/regioni.geojson

如果您使用此方法,需要将featureidkey='properties.NOME_REG'作为plotly.express.choropleth的参数进行明确传递。
工作示例:
import pandas as pd
import requests
import plotly.express as px

regions = ['Piemonte', 'Trentino-Alto Adige', 'Lombardia', 'Puglia', 'Basilicata', 
           'Friuli Venezia Giulia', 'Liguria', "Valle d'Aosta", 'Emilia-Romagna',
           'Molise', 'Lazio', 'Veneto', 'Sardegna', 'Sicilia', 'Abruzzo',
           'Calabria', 'Toscana', 'Umbria', 'Campania', 'Marche']

# Create a dataframe with the region names
df = pd.DataFrame(regions, columns=['NOME_REG'])
# For demonstration, create a column with the length of the region's name
df['name_length'] = df['NOME_REG'].str.len()

# Read the geojson data with Italy's regional borders from github
repo_url = 'https://gist.githubusercontent.com/datajournalism-it/48e29e7c87dca7eb1d29/raw/2636aeef92ba0770a073424853f37690064eb0ea/regioni.geojson'
italy_regions_geo = requests.get(repo_url).json()

# Choropleth representing the length of region names
fig = px.choropleth(data_frame=df, 
                    geojson=italy_regions_geo, 
                    locations='NOME_REG', # name of dataframe column
                    featureidkey='properties.NOME_REG',  # path to field in GeoJSON feature object with which to match the values passed in to locations
                    color='name_length',
                    color_continuous_scale="Magma",
                    scope="europe",
                   )
fig.update_geos(showcountries=False, showcoastlines=False, showland=False, fitbounds="locations")
fig.update_layout(margin={"r":0,"t":0,"l":0,"b":0})
fig.show()

输出图片


网页内容由stack overflow 提供, 点击上面的
可以查看英文原文,
原文链接