没有px.area属性可以直接给你一个单一的颜色。但这并不应该阻止你。只需要使用:
fig.for_each_trace(lambda trace: trace.update(fillcolor = trace.line.color))
要获得以下结果:
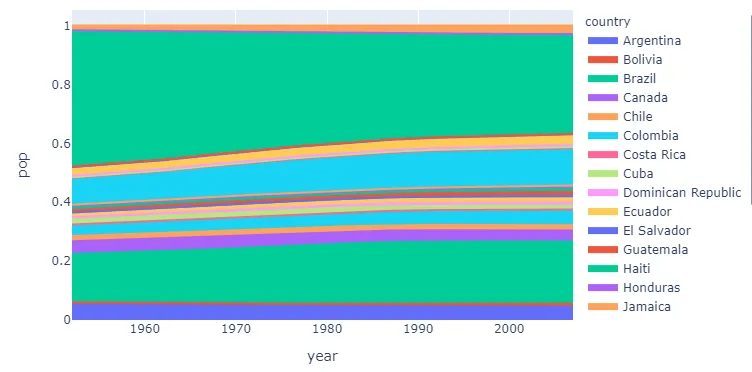
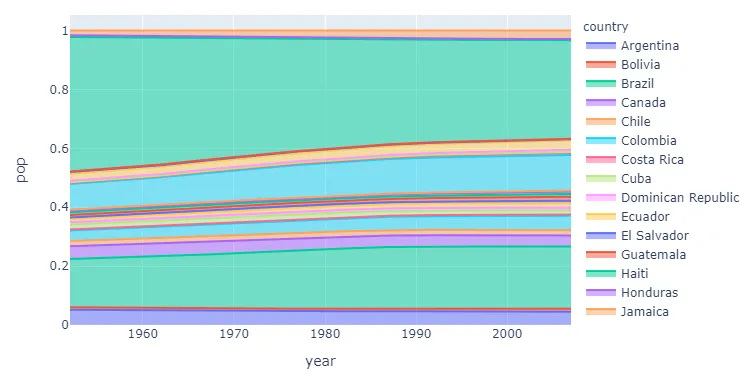
而不是默认结果:
完整代码:
import plotly
import plotly.express as px
df = px.data.gapminder()
df = df[df['continent']=='Americas']
fig = px.area(df, x="year", y="pop", color="country",
          groupnorm='fraction')
fig.for_each_trace(lambda trace: trace.update(fillcolor = trace.line.color))
fig.show()
一些细节:
px.area会为与color参数相关联的每条线分配一种颜色,然后将该颜色的半透明版本应用于相应的区域/填充。如果您运行fig.show,可以检查第一个类别的颜色:
Scatter({
    'fillcolor': '#636efa',
    'groupnorm': 'fraction',
    'hovertemplate': 'country=Argentina<br>year=%{x}<br>pop=%{y}<extra></extra>',
    'legendgroup': 'Argentina',
    'line': {'color': '#636efa'},
在这里,您只能看到'line': {'color': '#636efa'},很容易让人感到困惑,因为找不到fillcolor。但是如果您使用fig.full_figure_for_development,您可以看到实际传递给javascript的fillcolor是'rgba(99, 110, 250, 0.5)':
Scatter({
    'connectgaps': False,
    'error_x': {'visible': False},
    'error_y': {'visible': False},
    'fill': 'tonexty',
    'fillcolor': 'rgba(99, 110, 250, 0.5)',
这正是你运行时所覆盖的内容:
fig.for_each_trace(lambda trace: trace.update(fillcolor = trace.line.color))
plotly.express控制填充。这是一个无填充设置:fig.update_traces(fill='none')。请参考此链接。 - r-beginners