我一直很喜欢plotly express图表,但现在想用它们创建仪表板。 没有找到任何相关的文档。 是否有可能实现?
6个回答
30
我也曾苦恼于找不到答案,最后只好自己创造解决方案(请查看我完整的分析:如何使用Plotly Express创建子图)
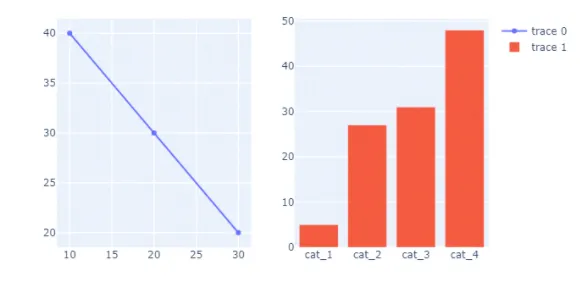
make_subplots()基本上是使用绘图轨迹来创建子图,而不是像Express返回的图形对象一样。所以你可以在Express中创建图形后,将Express图形对象拆分成其绘图轨迹,然后将它们的轨迹重新组合成子图。
代码:
import dash_core_components as dcc
import plotly.express as px
import plotly.subplots as sp


# Create figures in Express
figure1 = px.line(my_df)
figure2 = px.bar(my_df)

# For as many traces that exist per Express figure, get the traces from each plot and store them in an array.
# This is essentially breaking down the Express fig into it's traces
figure1_traces = []
figure2_traces = []
for trace in range(len(figure1["data"])):
    figure1_traces.append(figure1["data"][trace])
for trace in range(len(figure2["data"])):
    figure2_traces.append(figure2["data"][trace])

#Create a 1x2 subplot
this_figure = sp.make_subplots(rows=1, cols=2)

# Get the Express fig broken down as traces and add the traces to the proper plot within in the subplot
for traces in figure1_traces:
    this_figure.append_trace(traces, row=1, col=1)
for traces in figure2_traces:
    this_figure.append_trace(traces, row=1, col=2)

#the subplot as shown in the above image
final_graph = dcc.Graph(figure=this_figure)
输出:
- mmarion
4
17
基于 @mmarion 的解决方案:
import plotly.express as px
from plotly.offline import plot
from plotly.subplots import make_subplots

figures = [
            px.line(df1),
            px.line(df2)
    ]

fig = make_subplots(rows=len(figures), cols=1)

for i, figure in enumerate(figures):
    for trace in range(len(figure["data"])):
        fig.append_trace(figure["data"][trace], row=i+1, col=1)

plot(fig)
这可以轻松扩展到列维度。
- XiB
1
对于我来说,使用 iplot(fig) 替代 plot(fig) 起作用了。 - Enayat
3
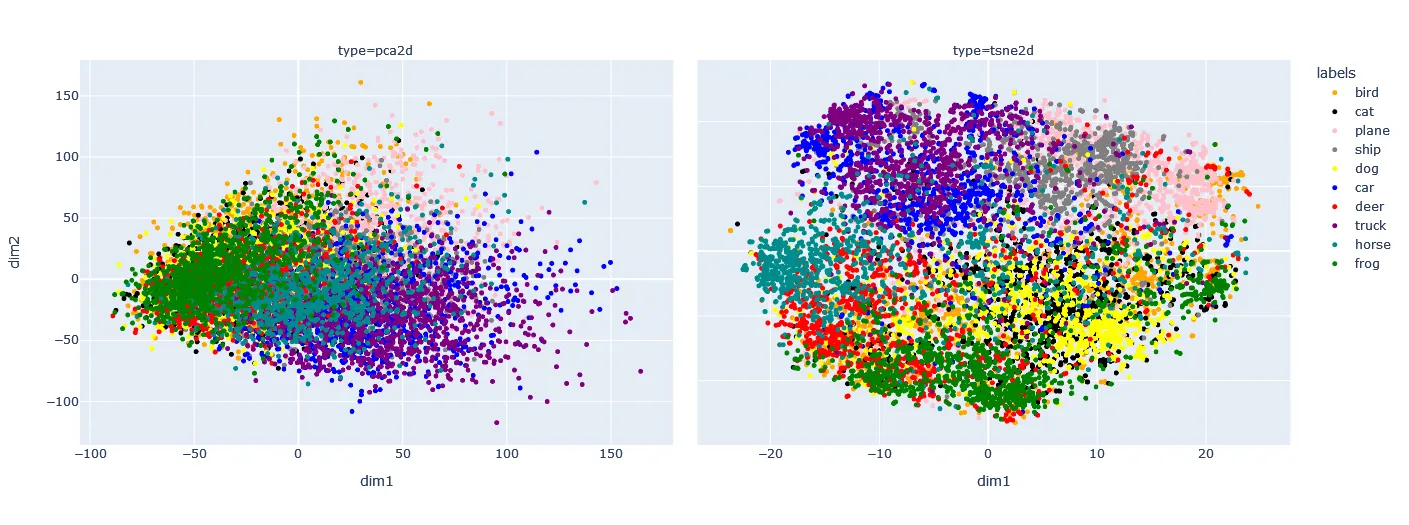
我通过将所有数据合并到单个数据框中解决了这个问题,其中有一个名为“type”的列来区分这两个图。 然后我使用 facet_col 创建了(某种形式的)子图:
px.scatter(df3, x='dim1', y='dim2', color='labels', facet_col='type')
- Alessandra
1
2只要所有的图表类型都相同,这可能是最好的方法。如果它们需要不同,您将无法使用 facets。 - Steven
1
尝试使用此函数。您需要将Plotly Express图传递到函数中,它将返回一个子图。
#quick_subplot function
def quick_subplot(n,nrows,ncols, *args): #n:number of subplots, nrows:no.of. rows, ncols:no of cols, args
    from dash import dcc
    import plotly.subplots as sp
    from plotly.subplots import make_subplots

    fig=[] #list to store figures
    for arg in args:
        fig.append(arg)


    combined_fig_title=str(input("Enter the figure title: "))
    tok1=int(input("Do you want to disable printing legends after the first legend is printed ? {0:Disable, 1:Enable} : "))

    fig_traces={} #Dictionary to store figure traces
    subplt_titles=[]

    #Appending the traces of the figures to a list in fig_traces dictionary
    for i in range(n):
        fig_traces[f'fig_trace{i}']=[]

        for trace in range(len(fig[i]["data"])):
            fig_traces[f'fig_trace{i}'].append(fig[i]["data"][trace])
            if(i!=0 & tok1==0):
                fig[i]["data"][trace]['showlegend'] = False #Disabling other legends

        subplt_titles.append(str(input(f"Enter subplot title for subplot-{i+1}: ")))

    #Creating a subplot
        #Change height and width of figure here if necessary
    combined_fig=sp.make_subplots(rows = nrows, cols = ncols, subplot_titles = subplt_titles)
    combined_fig.update_layout(height = 500, width = 1200, title_text = '<b>'+combined_fig_title+'<b>', title_font_size = 25)

    #Appending the traces to the newly created subplot
    i=0
    for a in range(1,nrows+1):
        for b in range(1, ncols+1):
            for traces in fig_traces[f"fig_trace{i}"]:
                combined_fig.append_trace(traces, row=a, col=b)
            i+=1


    #Setting axis titles
        #X-axis
    combined_fig['layout']['xaxis']['title']['font']['color']='blue'
    tok2=int(input("Separate x-axis titles?{0:'No',1:'Yes'}: "))

    for i in range(max(nrows,ncols)):
        if i==0:
            combined_fig['layout']['xaxis']['title']=str(input(
            f"Enter x-axis's title: "))

        if tok2 & i!=0:
            combined_fig['layout'][f'xaxis{i+1}']['title']=str(input(
            f"Enter x-axis {i+1}'s title: "))
            combined_fig['layout'][f'xaxis{i+1}']['title']['font']['color']='blue'


        #Y-axis
    combined_fig['layout']['yaxis']['title']['font']['color']='blue'
    tok3=int(input("Separate y-axis titles?{0:'No',1:'Yes'}: "))

    for i in range(max(nrows,ncols)):
        if i==0:
            combined_fig['layout']['yaxis']['title']=str(input(
            f"Enter y-axis's title: "))

        if tok3 & i!=0:
            combined_fig['layout'][f'yaxis{i+1}']['title']=str(input(
            f"Enter y-axis {i+1}'s title: "))

            combined_fig['layout'][f'yaxis{i+1}']['title']['font']['color']='blue'


    combined_fig['layout']['xaxis']['title']['font']['color']='blue'
    combined_fig['layout']['yaxis']['title']['font']['color']='blue'


    return combined_fig


f=quick_subplot(2,1,2,fig1,fig2)
f.show()
- Balaji Adithya
1
来自文档:
**facet_row**
(string: name of column in data_frame) Values from this column are used to assign marks to facetted subplots in the vertical direction.
**facet_col**
(string: name of column in data_frame) Values from this column are used to assign marks to facetted subplots in the horizontal direction.
在这里还可以找到一些例子。
https://medium.com/@plotlygraphs/introducing-plotly-express-808df010143d
- PythonNoob
1
1谢谢。facet_row允许创建有用的面板,但它们通常是不同部分的相同视图(例如)。我想将几个不相关的视图合并到一个仪表板中。这里提供Plotly示例供参考。https://plot.ly/dashboard/jackp:16823/present#/ - Animesh Dwivedi
网页内容由stack overflow 提供, 点击上面的可以查看英文原文,
原文链接
原文链接
this_figure应该可以很好地保存所有图形数据。 - mmarion