使用Plotly Express时,如何根据子图更改注释?

3
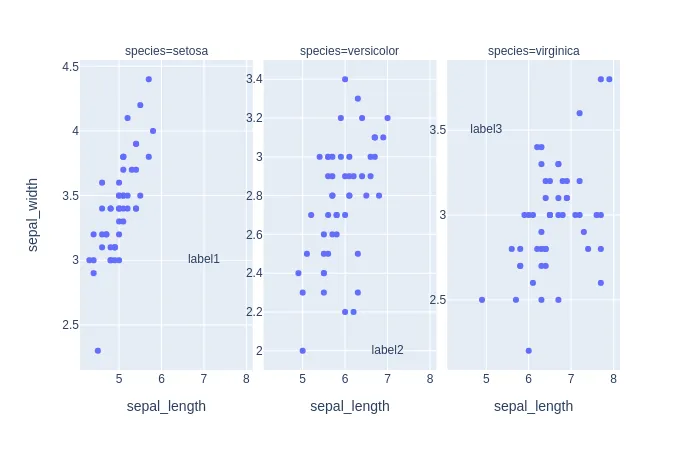
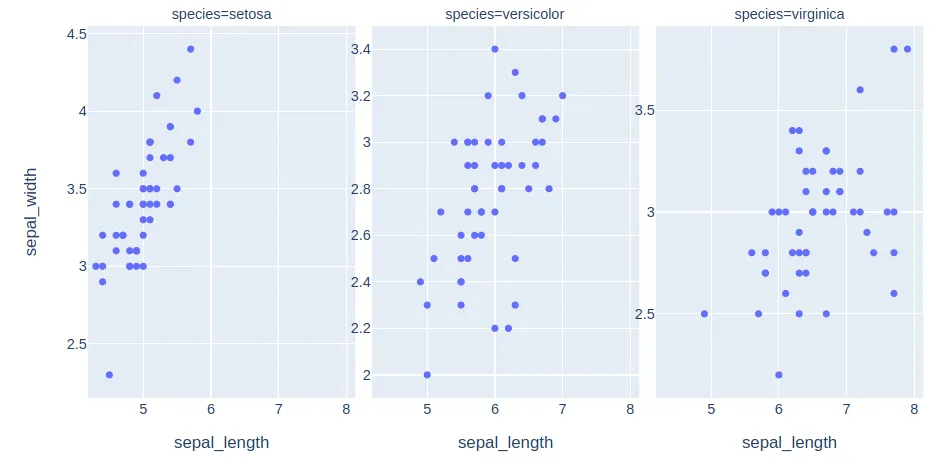
假设我想制作一个子图,每个面板都有自己的 y 轴刻度:
import plotly.express as px

fig = px.scatter(px.data.iris(), x='sepal_length', y='sepal_width', facet_col='species')


def update(y):
    y.update(matches=None)
    y.showticklabels=True

fig.for_each_yaxis(update)

输入图像描述

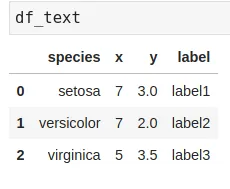
现在假设我想要添加一些注释,位置将根据分面变量而变化,并且我有一个数据框:

输入图像描述

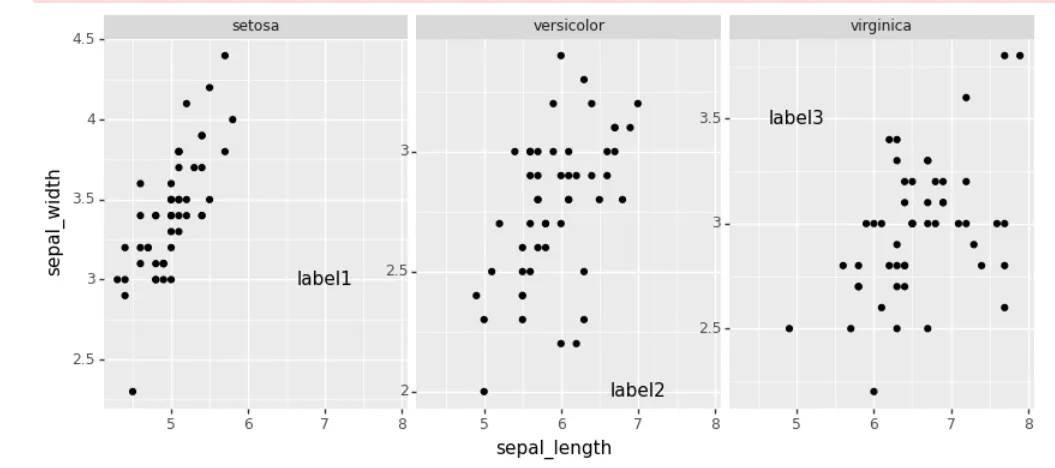
如果我正在使用plotnine/ggplot,可以这样做:

ggplot(df_iris, aes(x='sepal_length', y='sepal_width')) + geom_point() + facet_wrap("~species", scales="free_y") + geom_text(aes(x='x', y='y', label='label'), data=df_text) 

进入图像描述

在plotly中能否实现这个效果?我陷入了子图和注释的泥潭,我知道你可以向子图添加注释,但你必须知道行列数目才能这样做,而我不确定如何将划分变量(物种)映射到子图的行/列索引。

谢谢 :)

1个回答

4

我不确定这是否是最佳方法,但你可以尝试以下方式

import plotly.express as px
import pandas as pd

df_text = pd.DataFrame({"species":["setosa", "versicolor", "virginica"],
                        "x": [7, 7, 5],
                        "y": [3, 2, 3.5],
                        "label":["label1", "label2", "label3"]})

fig = px.scatter(px.data.iris(),
                 x='sepal_length',
                 y='sepal_width',
                 facet_col='species')

# Here are your annotations
data = px.scatter(df_text,
                  x="x",
                  y="y",
                  text="label",
                  facet_col='species')\
          .update_traces(mode="text")["data"]

def update(y):
    y.update(matches=None)
    y.showticklabels=True
    
fig.for_each_yaxis(update)

for trace in data:
    fig.add_trace(trace)

fig.show()

enter image description here


网页内容由stack overflow 提供, 点击上面的
可以查看英文原文,
原文链接