Plotly:如何将变量赋值给子图标题?

5
我希望在几个子图上显示额外的数据,并决定在子图标题中实现。
我已经想出了如何向子图添加标题,但无法在每个标题中包含变量。目前的代码是:
fig = make_subplots(rows=3, cols=1, subplot_titles=("Share Price is: ", "RSI is: ", "Portfolio Return is: "))

我想在每个子图标题的末尾添加变量。
如何实现?

1
这只是一个简单的字符串格式化问题。如果在 Py3.6+ 上,请查看 f-strings;否则请使用字符串格式化。 - S3DEV
2个回答

3

这段代码将帮助您完成此任务。基本上,只需使用字符串格式化(如果在Python 3.6+上,则可以使用f-strings)。

请注意变量声明在开头,然后在titles元组中使用了f-string替换。正如您将注意到的那样,由于使用了字符串,子图标题可以包含货币值、百分比、小数值......适合任何目的的内容。这些甚至可以直接从数据集中的值填充。

示例代码:

from plotly.subplots import make_subplots

shr = '£25.10'
rsi = '40%'
rtn = '12'

# Use f-strings to format the subplot titles.
titles = (f'Share Price is: {shr}', 
          f'RSI is: {rsi}', 
          f'Portfolio Return is: {rtn}')

fig = make_subplots(rows=3, 
                    cols=1, 
                    subplot_titles=titles)

fig.add_trace({'y': [1, 2, 3, 4, 5], 'name': 'Share Price'}, row=1, col=1)
fig.add_trace({'y': [5, 4, 2, 3, 1], 'name': 'RSI'}, row=2, col=1)
fig.add_trace({'y': [1, 4, 2, 3, 5], 'name': 'Return'}, row=3, col=1)

fig.show()

输出:

输入图像描述


1
很棒的f-strings! - vestland

0
在您的情况下,我会将不同的新元素组织到一个字典中:
infos = {'price':29,
         'RSI': 1.1,
         'return':1.1}

然后在make_subplots()中对该字典进行子集操作,如下所示:

fig = make_subplots(rows=3, cols=1, start_cell="top-left",
                    subplot_titles=("Share Price is: "+ str(infos['price']),
                                    "RSI is: " + str(infos['RSI']),
                                    "Portfolio Return is: " + str(infos['return'])))

为什么要用字典?我经常发现自己在定义图形后想对绘图元素进行操作。这样,您的新元素也将随时可用于其他目的。
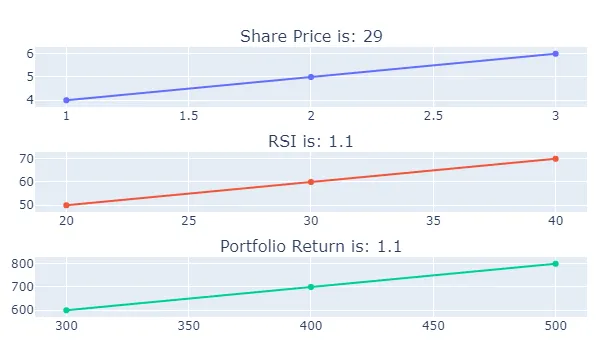
绘图:

enter image description here

完整代码:

import plotly.graph_objects as go
from plotly.subplots import make_subplots


infos = {'price':29,
         'RSI': 1.1,
         'return':1.1}

fig = make_subplots(rows=3, cols=1, start_cell="top-left",
                    subplot_titles=("Share Price is: "+ str(infos['price']),
                                    "RSI is: " + str(infos['RSI']),
                                    "Portfolio Return is: " + str(infos['return'])))

fig.add_trace(go.Scatter(x=[1, 2, 3], y=[4, 5, 6]),
              row=1, col=1)

fig.add_trace(go.Scatter(x=[20, 30, 40], y=[50, 60, 70]),
              row=2, col=1)

fig.add_trace(go.Scatter(x=[300, 400, 500], y=[600, 700, 800]),
              row=3, col=1)

fig.show()
f2 = fig.full_figure_for_development(warn=False)

网页内容由stack overflow 提供, 点击上面的
可以查看英文原文,
原文链接