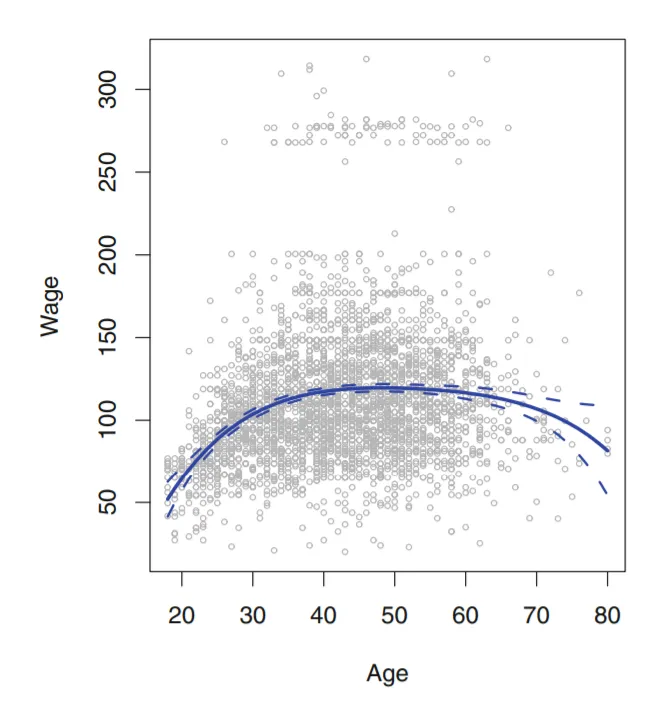
图7.1,《统计学习导论》
我正在学习一本名为《统计学习导论》的书,并将其解决方案转换为Python语言。
我不知道如何得到置信区间并像上图中那样绘制虚线。
我已经绘制了直线。以下是我的代码(使用预测变量“age”和响应变量“wage”,程度为4的多项式回归):
poly = PolynomialFeatures(4)
X = poly.fit_transform(data['age'].to_frame())
y = data['wage']
# X.shape
model = sm.OLS(y,X).fit()
print(model.summary())
# So, what we want here is not only the final line, but also the standart error related to the line
# TO find that we need to calcualte the predictions for some values of age
test_ages = np.linspace(data['age'].min(),data['age'].max(),100)
X_test = poly.transform(test_ages.reshape(-1,1))
pred = model.predict(X_test)
plt.figure(figsize = (12,8))
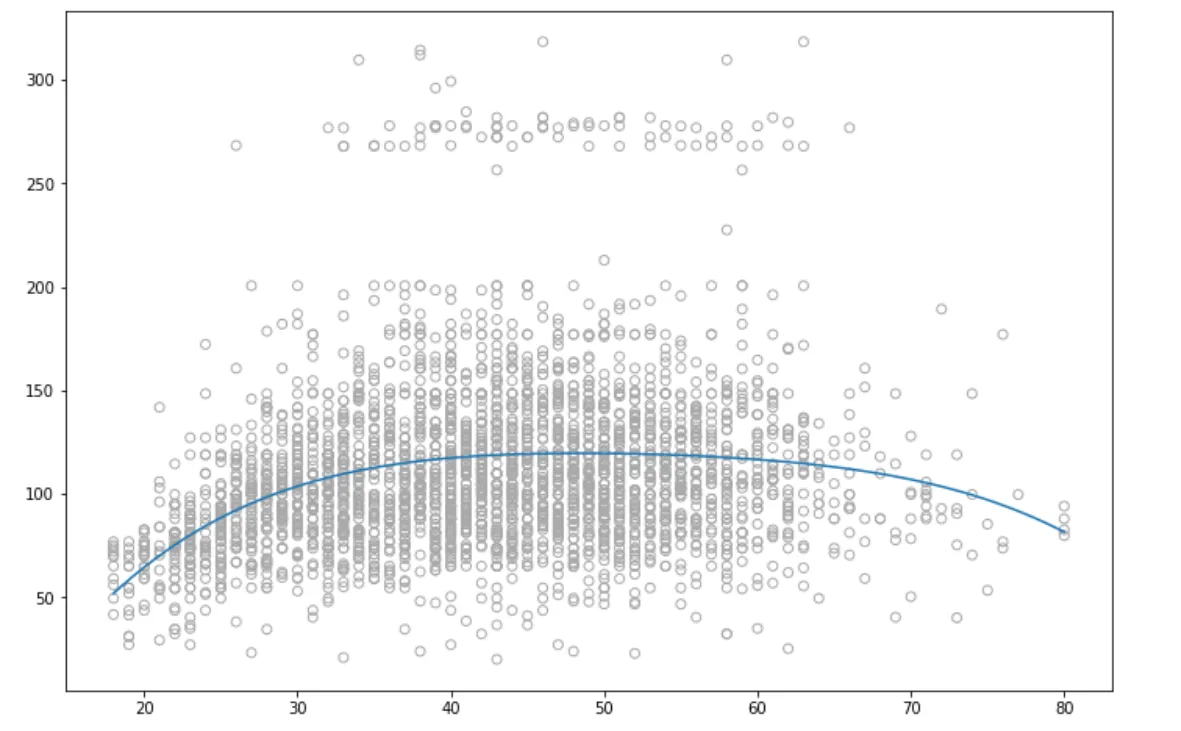
plt.scatter(data['age'],data['wage'],facecolors='none', edgecolors='darkgray')
plt.plot(test_ages,pred)
这里的数据是R中可用的薪资数据。以下是我得到的图形 -
def get_indices(self,data,num_samples): return np.random.choice(data.index, num_samples, replace=True)这段代码是做什么的吗? - thentangler