在Python中,我知道如何使用
scipy.stats.pearsonr计算r和相关的p值,但我找不到一种计算r置信区间的方法。这应该怎么做?感谢任何帮助 :)scipy.stats.pearsonr计算r和相关的p值,但我找不到一种计算r置信区间的方法。这应该怎么做?感谢任何帮助 :)def r_to_z(r):
return math.log((1 + r) / (1 - r)) / 2.0
def z_to_r(z):
e = math.exp(2 * z)
return((e - 1) / (e + 1))
def r_confidence_interval(r, alpha, n):
z = r_to_z(r)
se = 1.0 / math.sqrt(n - 3)
z_crit = stats.norm.ppf(1 - alpha/2) # 2-tailed z critical value
lo = z - z_crit * se
hi = z + z_crit * se
# Return a sequence
return (z_to_r(lo), z_to_r(hi))
Reference:
使用rpy2和心理测量库(您需要安装R并在其中运行install.packages("psychometric"))
from rpy2.robjects.packages import importr
psychometric=importr('psychometric')
psychometric.CIr(r=.9, n = 100, level = .95)
当0.9是你的相关系数,n是样本大小,0.95是置信水平时
import numpy as np


def pearsonr_ci(x, y, ci=95, n_boots=10000):
    x = np.asarray(x)
    y = np.asarray(y)

   # (n_boots, n_observations) paired arrays
    rand_ixs = np.random.randint(0, x.shape[0], size=(n_boots, x.shape[0]))
    x_boots = x[rand_ixs]
    y_boots = y[rand_ixs]

    # differences from mean
    x_mdiffs = x_boots - x_boots.mean(axis=1)[:, None]
    y_mdiffs = y_boots - y_boots.mean(axis=1)[:, None]

    # sums of squares
    x_ss = np.einsum('ij, ij -> i', x_mdiffs, x_mdiffs)
    y_ss = np.einsum('ij, ij -> i', y_mdiffs, y_mdiffs)

    # pearson correlations
    r_boots = np.einsum('ij, ij -> i', x_mdiffs, y_mdiffs) / np.sqrt(x_ss * y_ss)

    # upper and lower bounds for confidence interval
    ci_low = np.percentile(r_boots, (100 - ci) / 2)
    ci_high = np.percentile(r_boots, (ci + 100) / 2)
    return ci_low, ci_high
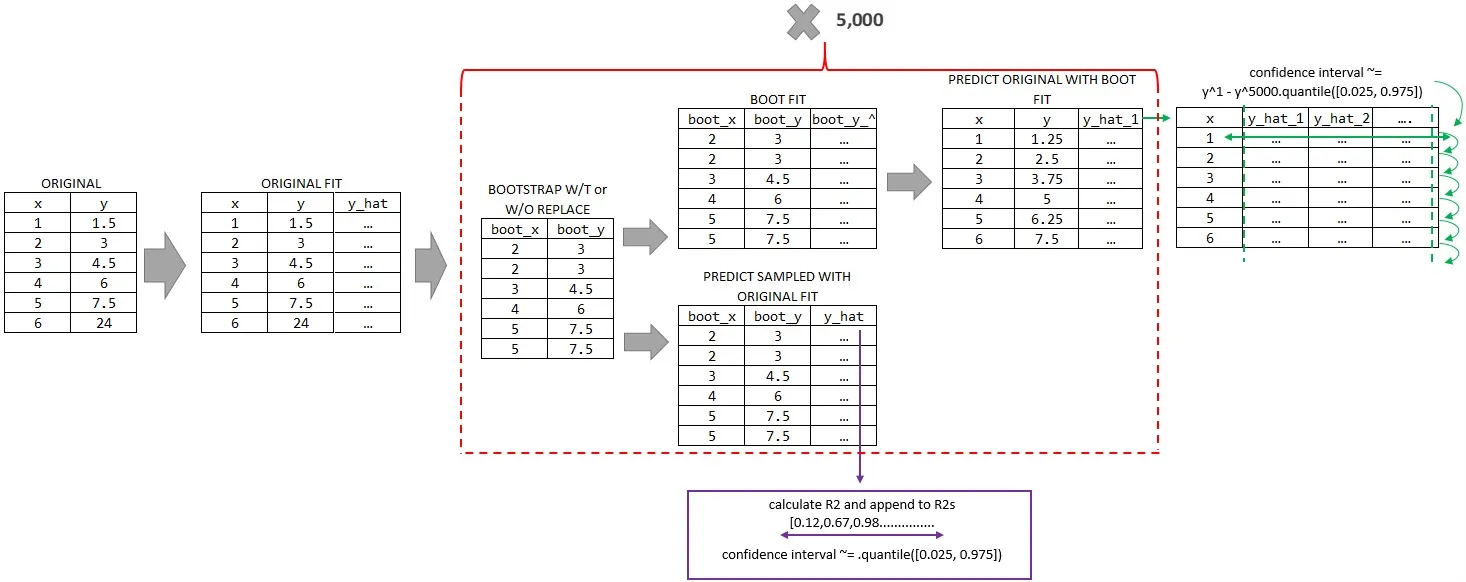
我知道上面提到了引导法,下面提出另一种变体,可能更适合其他设置。
#1 对数据进行抽样(成对的X和Y,也可以添加其他权重),在其上拟合原始模型,记录r2并附加。然后从所有记录的R2分布中提取置信区间。
#2 此外,可以在抽样数据上进行拟合,并使用抽样数据模型预测非抽样X (也可以提供连续范围以扩展您的预测,而不是使用原始X),以获得关于您的Y hat的置信区间。
因此,在示例代码中:
import numpy as np
from scipy.optimize import curve_fit
import pandas as pd
from sklearn.metrics import r2_score


x = np.array([your numbers here])
y = np.array([your numbers here])


### define list for R2 values
r2s = []

### define dataframe to append your bootstrapped fits for Y hat ranges
ci_df = pd.DataFrame({'x': x})

### define how many samples you want
how_many_straps = 5000

### define your fit function/s
def func_exponential(x,a,b):
    return np.exp(b) * np.exp(a * x)

### fit original, using log because fitting exponential
polyfit_original = np.polyfit(x
                              ,np.log(y)
                              ,1
                              ,# w= could supply weight for observations here)
                              )

for i in range(how_many_straps+1):

    ### zip into tuples attaching X to Y, can combine more variables as well
    zipped_for_boot = pd.Series(tuple(zip(x,y)))

    ### sample zipped X & Y pairs above with replacement
    zipped_resampled = zipped_for_boot.sample(frac=1,
                                              replace=True)

    ### creater your sampled X & Y
    boot_x = []
    boot_y = []

    for sample in zipped_resampled:
        boot_x.append(sample[0])
        boot_y.append(sample[1])

    ### predict sampled using original fit
    y_hat_boot_via_original_fit = func_exponential(np.asarray(boot_x),
                                                   polyfit_original[0],
                                                   polyfit_original[1])

    ### calculate r2 and append
    r2s.append(r2_score(boot_y,  y_hat_boot_via_original_fit))


    ### fit sampled
    polyfit_boot = np.polyfit(boot_x
                              ,np.log(boot_y)
                              ,1
                              ,# w= could supply weight for observations here)
                              )


    ### predict original via sampled fit or on a range of min(x) to Z
    y_hat_original_via_sampled_fit = func_exponential(x,
                                                      polyfit_boot[0],
                                                      polyfit_boot[1])


    ### insert y hat into dataframe for calculating y hat confidence intervals
    ci_df["trial_" + str(i)] = y_hat_original_via_sampled_fit


### R2 conf interval
low = round(pd.Series(r2s).quantile([0.025, 0.975]).tolist()[0],3)
up = round(pd.Series(r2s).quantile([0.025, 0.975]).tolist()[1],3)
F"r2 confidence interval = {low} - {up}"
bennylp给出的答案大部分正确,但是在第三个函数中计算临界值时存在一个小错误。
正确的应该是:
def r_confidence_interval(r, alpha, n):
    z = r_to_z(r)
    se = 1.0 / math.sqrt(n - 3)
    z_crit = stats.norm.ppf((1 + alpha)/2)  # 2-tailed z critical value

    lo = z - z_crit * se
    hi = z + z_crit * se

    # Return a sequence
    return (z_to_r(lo), z_to_r(hi))
这里有另一篇参考文章:Scipy - 用于 z 值的双尾 ppf 函数?
alpha,而您的假设您将1-alpha传递给它。例如,对于95%的置信区间,他的函数使用alpha=0.05,而您的函数使用alpha=0.95会得出相同的答案。 - paxton4416