如何在R中绘制置信区间

3

我需要为我运行的预测绘制置信区间图。我可以运行预测,但是当我尝试绘制预测时,我得到的是一条穿过所有数据点的线,而不是实际的置信区间。

GunRate <- seq(0,100, length = 51)

LinearPredictionA <- predict(ModelA, 
    interval = "confidence", 
    newdata = data.frame(ProportionAdultsLivingWithGun = GunRate, 
                         LogMedianIncome = FinalSet$LogMedianIncome, 
                         PctofPeopleinMetro = FinalSet$PctofPeopleinMetro, 
                         PovertyRate = FinalSet$PovertyRate))

##This is my prediction model

plot(x = FinalSet$ProportionAdultsLivingWithGun, 
     y = FinalSet$ViolentCrime1K, 
     col = "red", 
     xlim = c(0, 80), ylim = c(0, 15), 
     xlab ="Proportion of Adults Living With a Gun", 
     ylab = "Violent Crime Rate per 1000", 
     main = "Violent Crime vs. Gun Ownership", 
     sub = "All 50 States & D.C.")

## This plot shows the actual data we used to obtain the prediction


lines(GunRate, LinearPredictionA[, "fit"], type = "l")
lines(GunRate, LinearPredictionA[, "lwr"], lty = "dashed", col = "green")
lines(GunRate, LinearPredictionA[, "upr"], lty = "dashed", col = "green")

这些线性函数本应绘制我的CI图表,但实际上我得到了以下图表。

1
这对我来说看起来像是虚线绿线是你的置信区间。 - G5W
是的,但它是通过我的CI上所有点的一条线。黑线应该是直的,而两条绿线应该呈弓形。 - BColvin
我们似乎没有你的示例中的
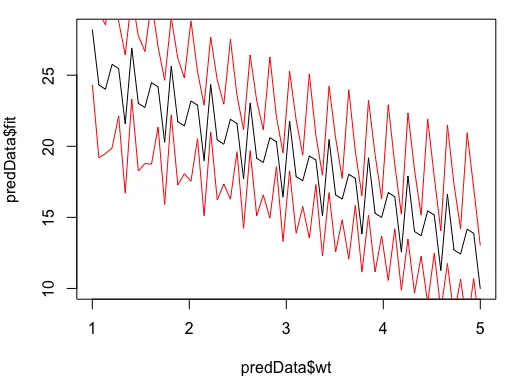
FinalSet数据。也没有ModelA。Model A是如何生成的? - G5W
1
ModelA 是否有多个预测变量?如果是这样,那么一个预测值与单个预测变量值的图通常不会是一条直线(即使该模型没有交互作用或高阶预测变量),除非您使用其他所有预测变量的值均固定为单个值来生成预测。 - eipi10
FinalSet$LogMedianIncome 中有多少个唯一值?FinalSet$PctofPeopleinMetroFinalSet$PovertyRate 同样的问题。 - eipi10
显示剩余10条评论
1个回答

3

以下是一个使用内置的 mtcars 数据框出现问题的示例:

# Regression model
m1 = lm(mpg ~ wt + hp + cyl, data=mtcars)

现在让我们预测mpgwt之间的关系,但是使用两个不同的交替值hp和三个不同的交替值cyl
predData = data.frame(wt=seq(1,5,length=60), hp=rep(c(200,300), 30), cyl=rep(c(4,6,8), 20))
predData = cbind(predData, predict(m1, newdata=predData, interval="confidence"))

注意预测值的波动,因为每个连续的wt值对应的hpcyl都会发生变化:

plot(predData$wt, predData$fit, type="l")
lines(predData$wt, predData$lwr, type="l", col="red")
lines(predData$wt, predData$upr, type="l", col="red")

enter image description here

然而,当我们固定hpcyl时,对wtmpg的预测结果呈直线关系:

predData2 = data.frame(wt=seq(1,5,length=60), hp=rep(300,60), cyl=rep(6, 60))
predData2 = cbind(predData2, predict(m1, newdata=predData2, interval="confidence"))

plot(predData2$wt, predData2$fit, type="l")
lines(predData2$wt, predData2$lwr, type="l", col="red")
lines(predData2$wt, predData2$upr, type="l", col="red")

在此输入图像描述

除了单一线条外,您还可以为另一个变量的多个值绘制预测的mpg vs. wt线条。下面是一个示例,我们为每个用于创建predDatacyl值绘制一条线。这更容易使用ggplot2实现,因此我已经使用了该软件包。使用置信区间的线条会使图形难以理解,因此我使用填充显示了CI:

library(ggplot2)

ggplot(subset(predData, hp==200), aes(wt, fit, fill=factor(cyl), colour=factor(cyl))) +
  geom_ribbon(aes(ymin=lwr, max=upr), alpha=0.2, colour=NA) +
  geom_line() +
  labs(x="Weight", y="Predicted MPG", colour="Cylinders", fill="Cylinders") +
  theme_bw()

enter image description here


网页内容由stack overflow 提供, 点击上面的
可以查看英文原文,
原文链接