在 ggplot 中更改 geom_bar 的宽度

5

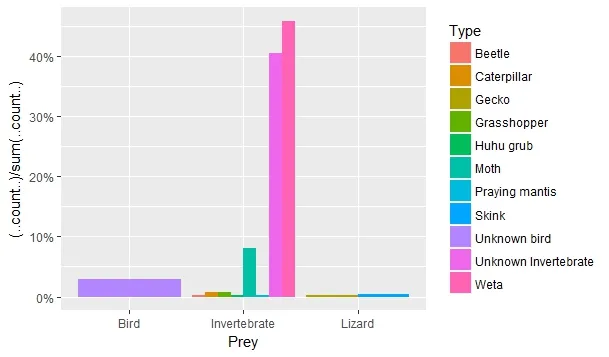
我正在制作一张柱状图,展示不同类型的猎物在巢穴中所占比例。

我的数据如下:

Prey <- c(rep("Bird", 12), rep("Lizard", 3), rep("Invertebrate", 406))  
Type <- c(rep("Unknown bird", 12), rep("Skink", 2), rep("Gecko", 1), 
          rep("Unknown Invertebrate", 170), rep("Beetle", 1), 
          rep("Caterpillar", 3), rep("Grasshopper", 3), rep("Huhu grub", 1),  
          rep("Moth", 34), rep("Praying mantis", 1), rep("Weta", 193))  
Preydata <- data.frame(Prey,Type)  

ggplot(Preydata, aes(x = Prey, y = (..count..)/sum(..count..))) +
                  scale_y_continuous(labels = percent_format()) + 
                  geom_bar(aes(fill = Type), position = "dodge")

我的图像看起来像下面的情节。

enter image description here

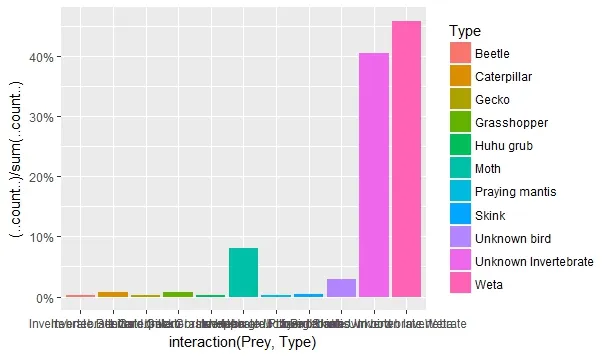
我希望所有“type”条形宽度都相同,但当我在 geom_bar 下更改宽度时,只会更改“prey”条的宽度。当我尝试使用以下内容时:

ggplot(Preydata, aes(x = as.numeric(interaction(Prey, Type)), 
    y = (..count..)/sum(..count..))) + 
    scale_y_continuous(labels = percent_format()) + 
    geom_bar(aes(fill = Type), position = "dodge")

我的柱状图不再按预设的顺序排列或分组,有没有办法可以改变这种情况呢? enter image description here


谢谢。那很有帮助,但我不确定如何在使用interaction()代码的同时保持绘图的原始顺序。 - Fbj9506
1
从手册上来看,通常建议使用类似这样的代码
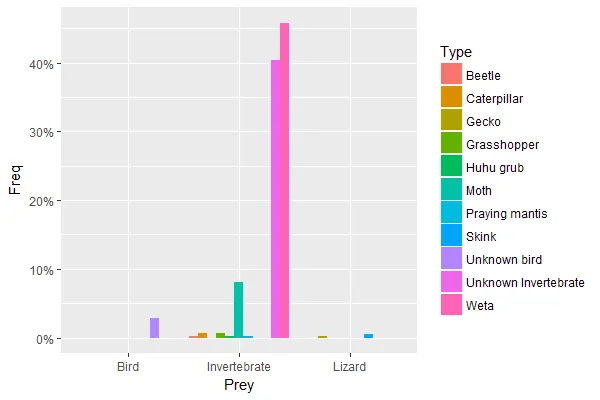
geom_bar(position = position_dodge(preserve = "single")) - PatrickT
1个回答

3
通过使用tableprop.table在绘图之前准备数据,可以确保包括PreyType的所有可能组合。这迫使条形图具有相同的宽度而不改变条形的顺序。
因此,这是一种替代方法,用于使用交互绑定缺失组合,后者已被标记为重复。
Preydata2 <- as.data.frame(prop.table(table(Preydata$Prey, Preydata$Type)))
names(Preydata2) <- c("Prey", "Type", "Freq")

library(ggplot2)
library(scales)
ggplot(Preydata2, aes(x = Prey, y = Freq, fill = Type)) +
  scale_y_continuous(labels = percent_format()) + 
  geom_col(position = "dodge")

生成

进入图像说明

解释

table(Preydata$Prey, Preydata$Type)创建一个列出所有PreyType的组合的列联表,即使这些组合在基础数据中不存在:

             Beetle Caterpillar Gecko Grasshopper Huhu grub Moth Praying mantis Skink Unknown bird
Bird              0           0     0           0         0    0              0     0           12
Invertebrate      1           3     0           3         1   34              1     0            0
Lizard            0           0     1           0         0    0              0     2            0

             Unknown Invertebrate Weta
Bird                            0    0
Invertebrate                  170  193
Lizard                          0    0

prop.table函数将计数转换为分数。 这相当于OP中(.. count ..) / sum(..count..)的计算。

数据准备的最后一步是将表格转换为数据帧,这是ggplot所需的格式,并适当地重命名列。

绘图命令与OP类似,但有以下不同:

  • 使用已经计算好的Freq,而非实时计算 (..count..)/sum(..count..)
  • fill的美学特性被移到了对ggplot()的初始调用中,
  • 并且geom_col用作geom_bar(stat = "identity")的简写(在ggplot2 2.2.0版本中引入的新函数)。

网页内容由stack overflow 提供, 点击上面的
可以查看英文原文,
原文链接