在ggplot中调整geom_bar(position="dodge")

19

我想在ggplot中创建一个双变量条形图,其中一个度量部分隐藏在另一个度量后面。在Excel中,我可以使用序列重叠来完成这个操作,并得到这个结果

使用geom_bar (position="dodge")将两个条形图并排放置。是否有任何方法可以调整此设置?

一些代码:

library (ggplot2)
library(reshape2)
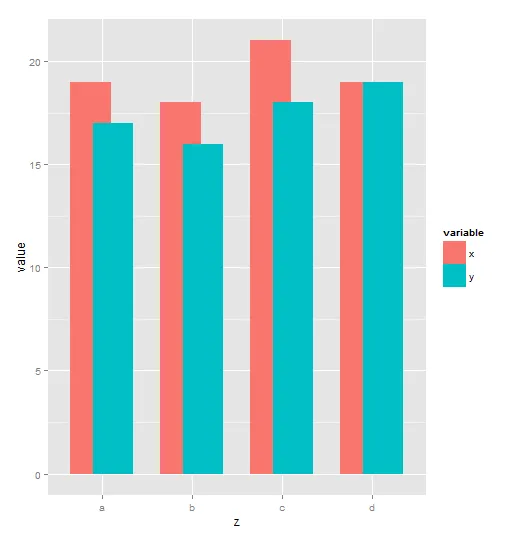
x <- c(19, 18, 21, 19)
y <- c(17, 16, 18, 19)
z <- c("a", "b", "c", "d")

df <- melt (data.frame (x,y,z))

ggplot (df, aes(x=z, y=value, fill=variable)) + geom_bar (stat="identity", position ="dodge")
2个回答

26

您可以通过指定position = position_dodge(...)来自定义“躲避”。

ggplot (df, aes(x=z, y=value, fill=variable)) + 
  geom_bar (stat="identity", position = position_dodge(width = 0.5))

这里输入图片描述


1
我想指出的是,“position_dodge”的自定义量令人难以置信。http://ggplot2.tidyverse.org/reference/geom_bar.html - PatrickT

2

在上述帮助下,我解决了这个问题,但需要进一步的调整:

ggplot(df, aes(x=z, y=value, fill=variable)) + 
  geom_bar(stat="identity", position = position_dodge2(width = 0.5, preserve = "single", padding = -0.5))

网页内容由stack overflow 提供, 点击上面的
可以查看英文原文,
原文链接