快要疯了。我有一个被熔化的数据框,我正在尝试在ggplot2中显示一个简单的分组条形图:
modality <- c("CLASS", "CLASS", "ONLINE", "ONLINE", "HYBRID", "HYBRID")
survey <- c("A Pre", "A Post", "B Pre", "B Post", "C Pre", "C Post")
score <- c(3.45, 4.15, 4.12, 4.34, 4.06, 4.57)
df = data.frame(modality, survey, score)

ggplot(df, aes(fill=modality, y=score, x=survey)) +
  geom_bar(position="dodge", stat="identity")
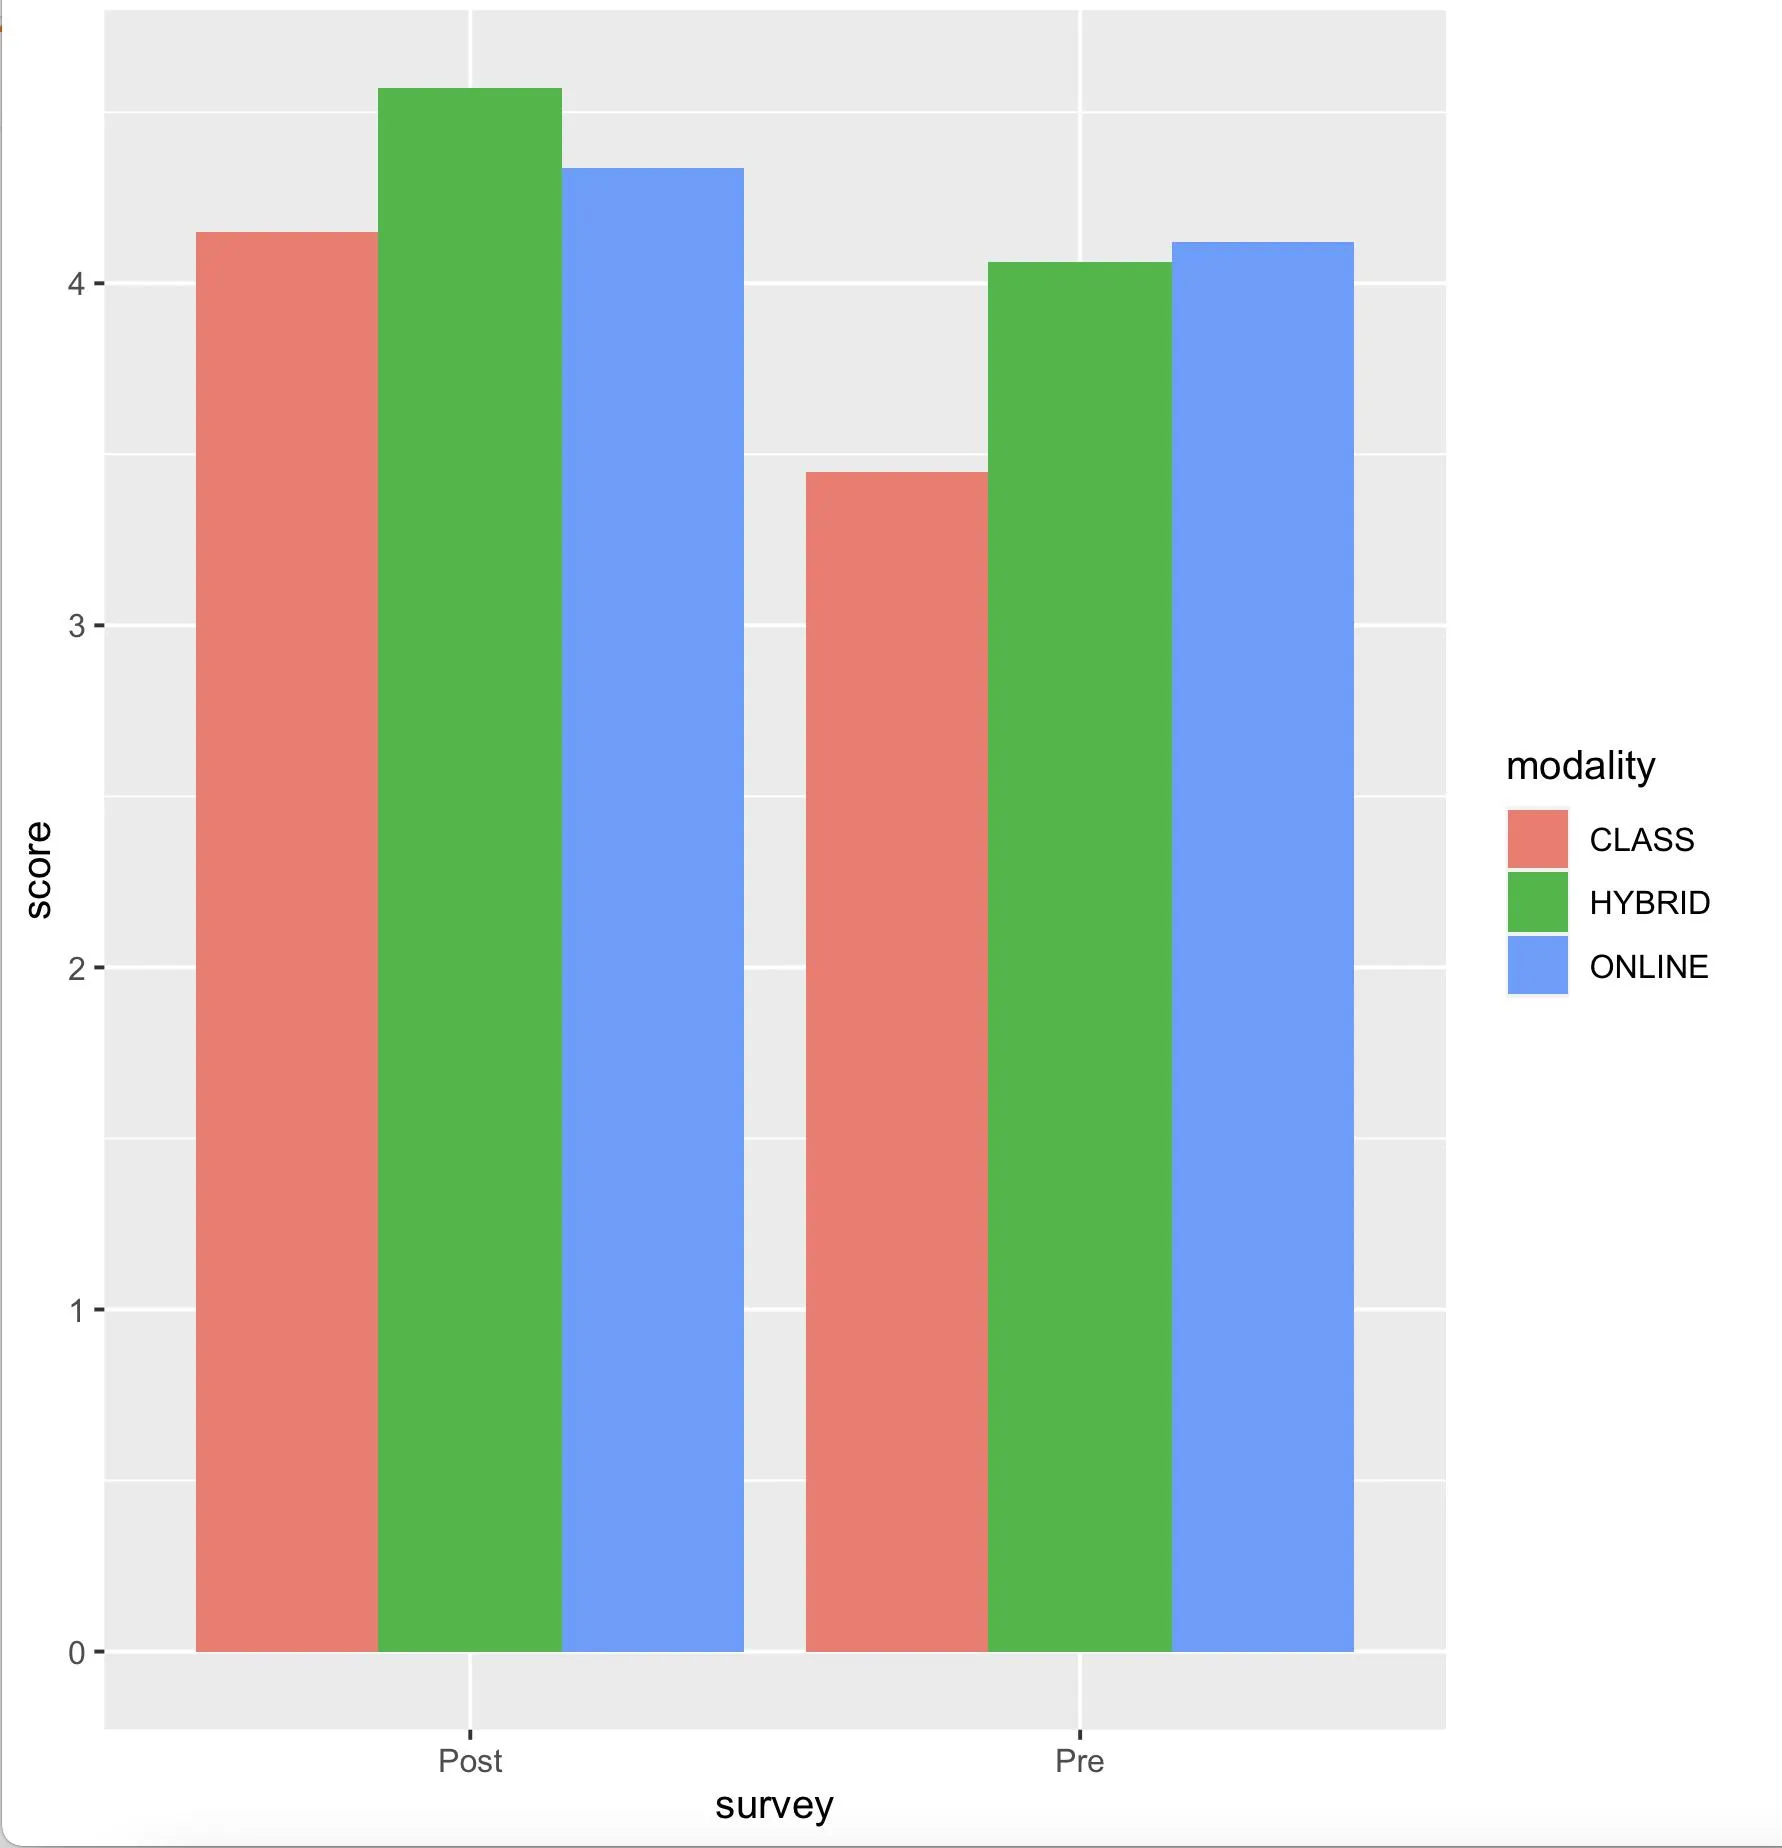
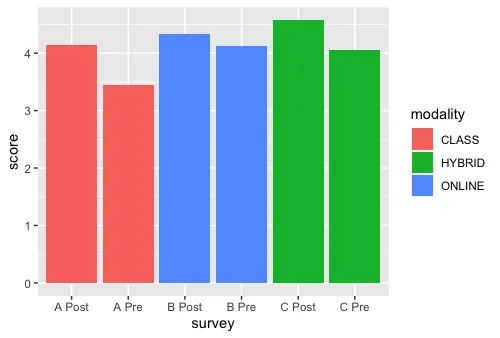
我原本期望柱状图按模态分组,但是它却产生了这样的结果:
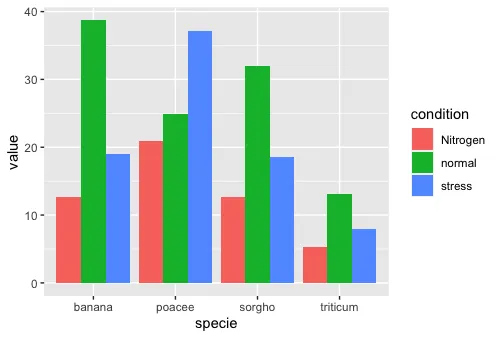
 我试着尽可能地按照r-graph-gallery的示例设置,但那个能正常工作。
specie <- c(rep("sorgho" , 3) , rep("poacee" , 3) , rep("banana" , 3) , rep("triticum" , 3) )
condition <- rep(c("normal" , "stress" , "Nitrogen") , 4)
value <- abs(rnorm(12 , 0 , 15))
data <- data.frame(specie,condition,value)

ggplot(data, aes(fill=condition, y=value, x=specie)) +
  geom_bar(position="dodge", stat="identity")
结果:
 我没有看到这两个数据框架的结构有任何区别,但我认为它们之间存在差异。我真的很想知道我在这里忽略了什么。谢谢!