Datalink: 使用的数据
我的代码:
ccfsisims <- read.csv(file = "F:/Purdue University/RA_Position/PhD_ResearchandDissert/PhD_Draft/GTAP-CGE/GTAP_NewAggDatabase/NewFiles/GTAP_ConsIndex.csv", header=TRUE, sep=",", na.string="NA", dec=".", strip.white=TRUE)
ccfsirsts <- as.data.frame(ccfsisims)
ccfsirsts[6:24] <- sapply(ccfsirsts[6:24],as.numeric)
ccfsirsts <- droplevels(ccfsirsts)
ccfsirsts <- transform(ccfsirsts,sres=factor(sres,levels=unique(sres)))
library(ggplot2)
#------------------------------------------------------------------------------------------
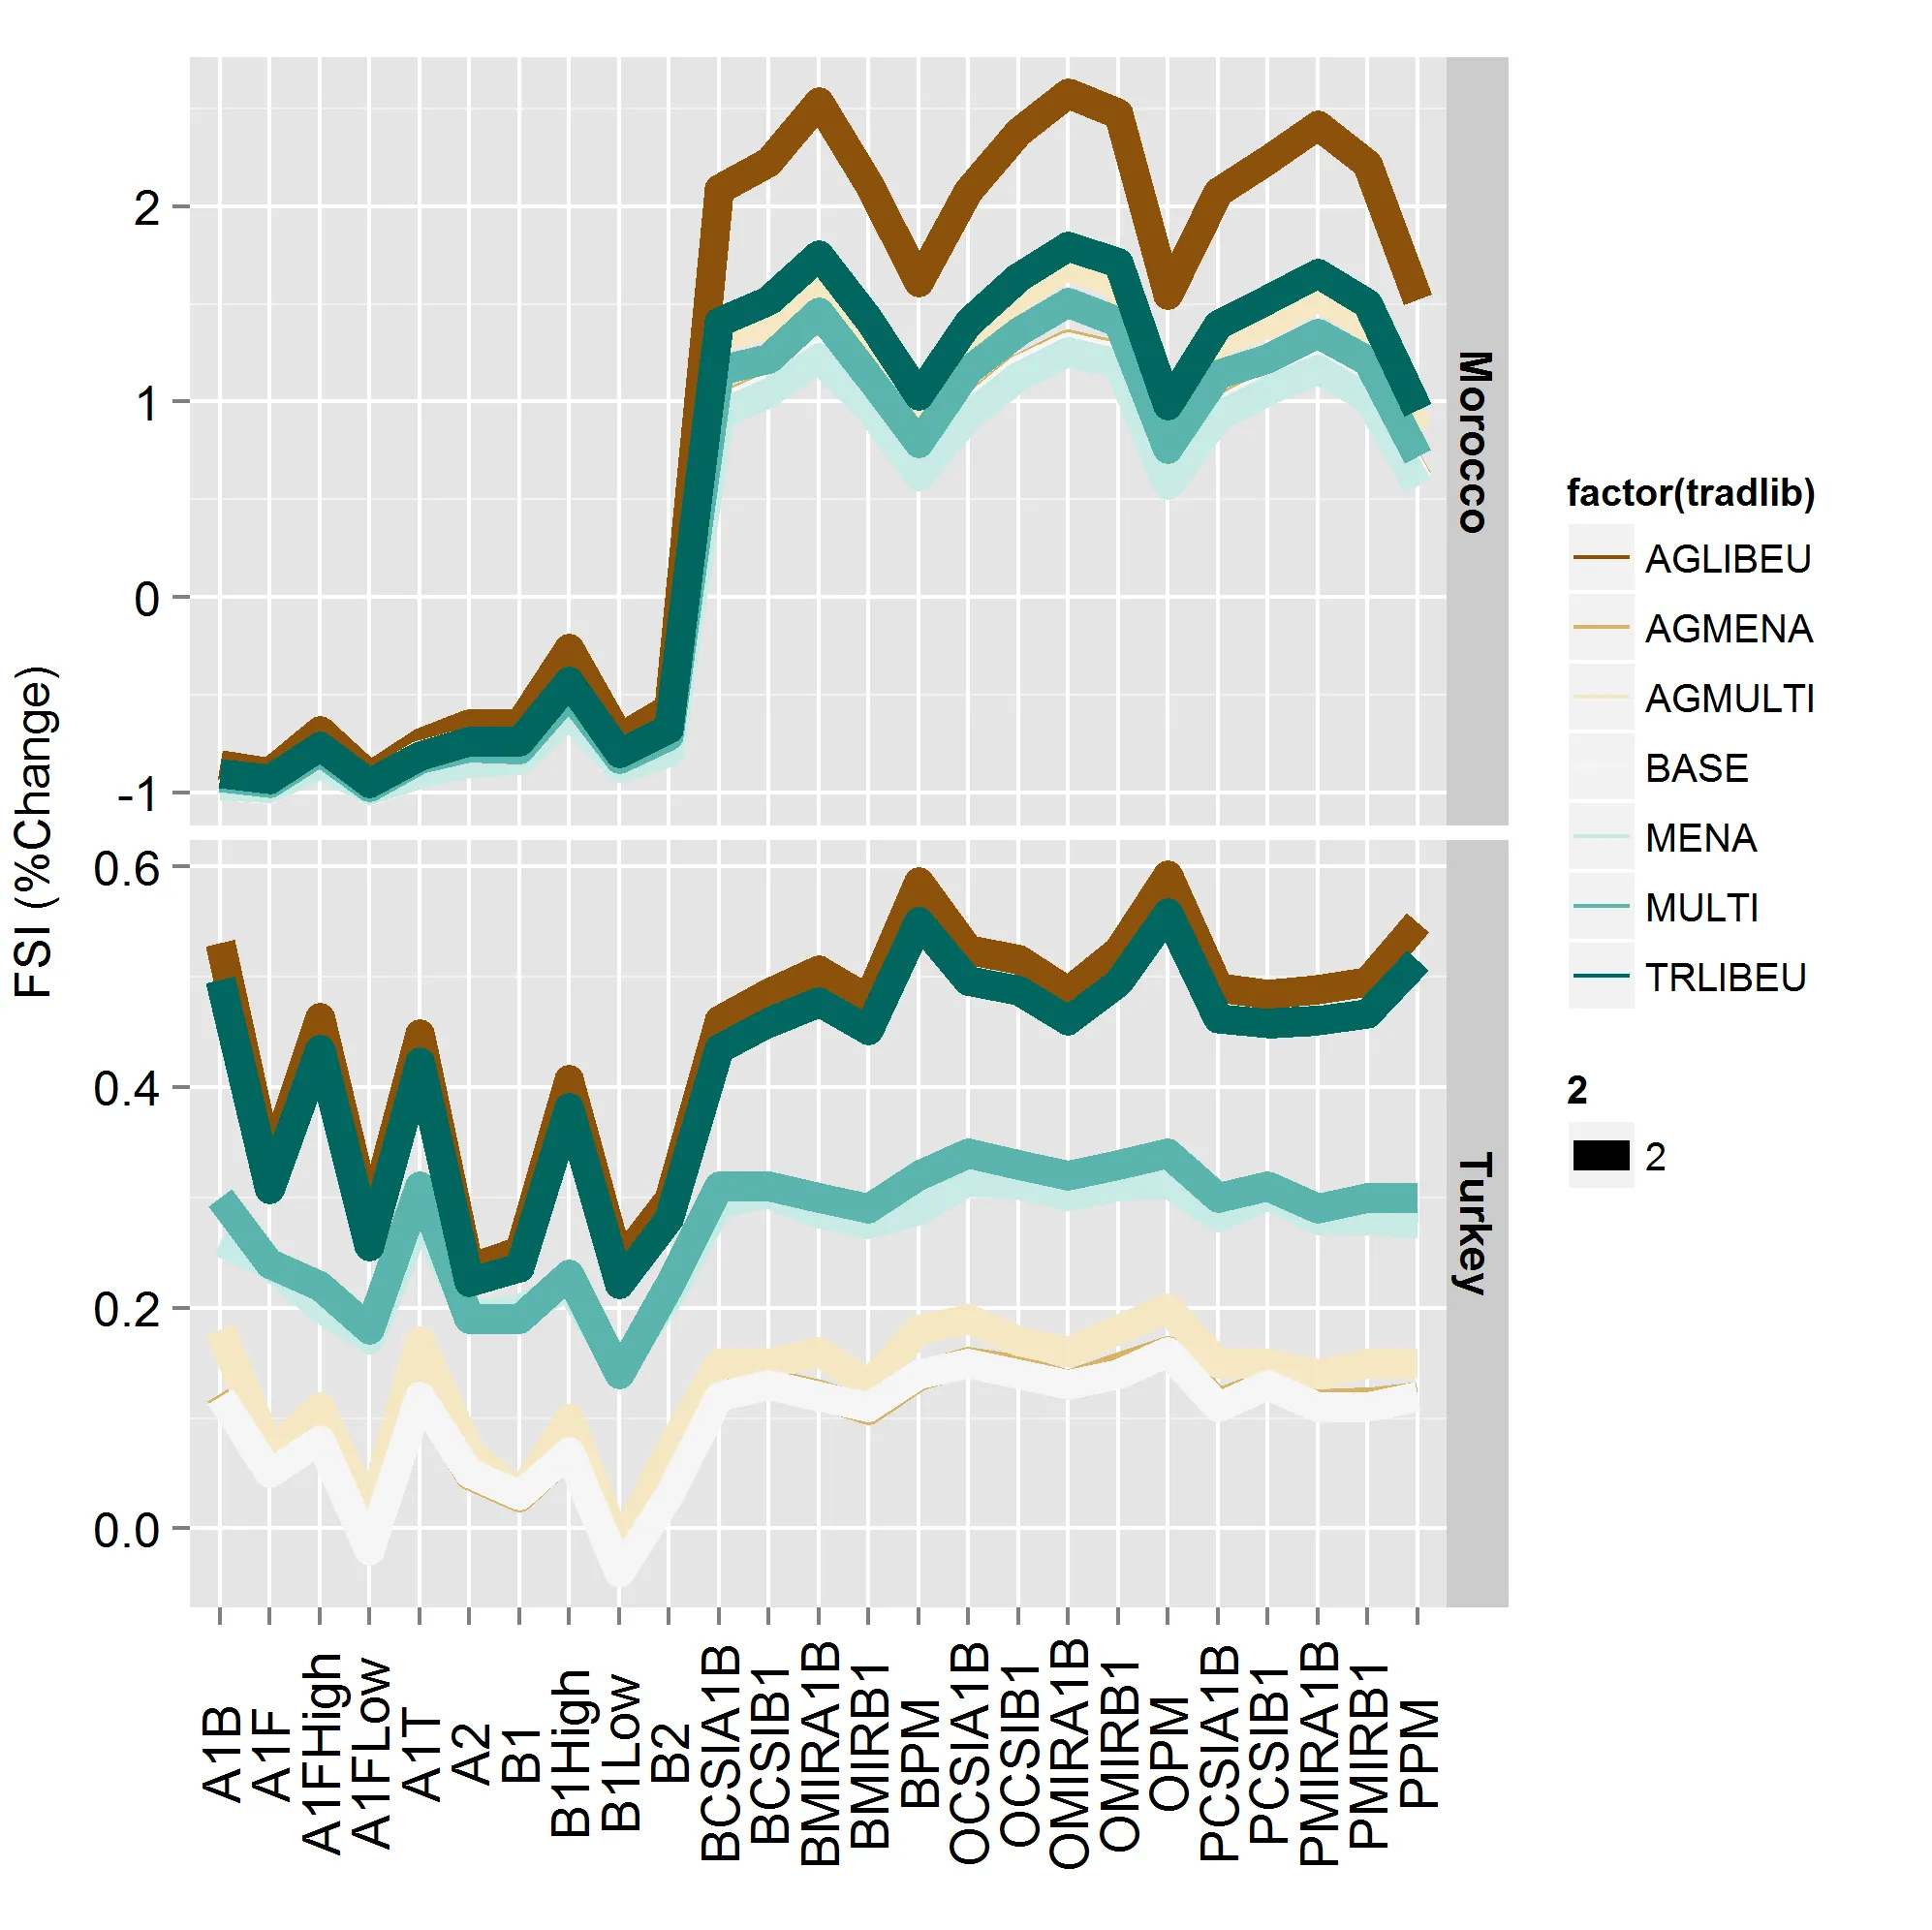
#### Plot of food security index for Morocco and Turkey by sector
#------------------------------------------------------------------------------------------
#_Code_Begin...
datamortur <- melt(ccfsirsts[ccfsirsts$region %in% c("TUR","MAR"), ]) # Selecting regions of interest
datamortur1 <- datamortur[datamortur$variable %in% c("pFSI2"), ] # Selecting the food security index of interest
datamortur2 <- datamortur1[datamortur1$sector %in% c("wht","gro","VegtFrut","osd","OthCrop","VegtOil","XPrFood"), ] # Selecting food sectors of interest
datamortur3 <- subset(datamortur2, tradlib !="BASEDATA") # Eliminating the "BASEDATA" scenario results
allfsi.f <- datamortur3
fsi.wht <- allfsi.f[allfsi.f$sector %in% c("wht"), ]
Figure29 <- ggplot(data=fsi.wht, aes(x=factor(sres),y=value,colour=factor(tradlib)))
Figure29 + geom_line(aes(group=factor(tradlib),size=2)) + facet_grid(regionsFull~., scales="free_y", labeller=reg_labeller) + scale_colour_brewer(type = "div") +
theme(axis.text.x = element_text(colour = 'black', angle = 90, size = 13, hjust = 0.5, vjust = 0.5),axis.title.x=element_blank()) +
ylab("FSI (%Change)") + theme(axis.text.y = element_text(colour = 'black', size = 12), axis.title.y = element_text(size = 12, hjust = 0.5, vjust = 0.2)) +
theme(strip.text.y = element_text(size = 11, hjust = 0.5, vjust = 0.5, face = 'bold'))
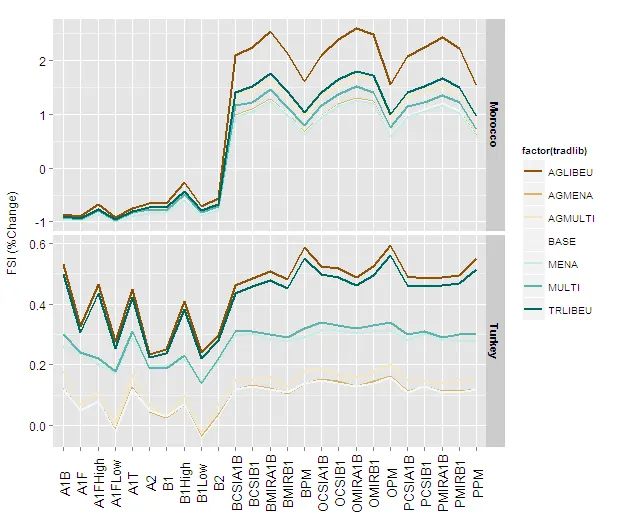
我的结果:
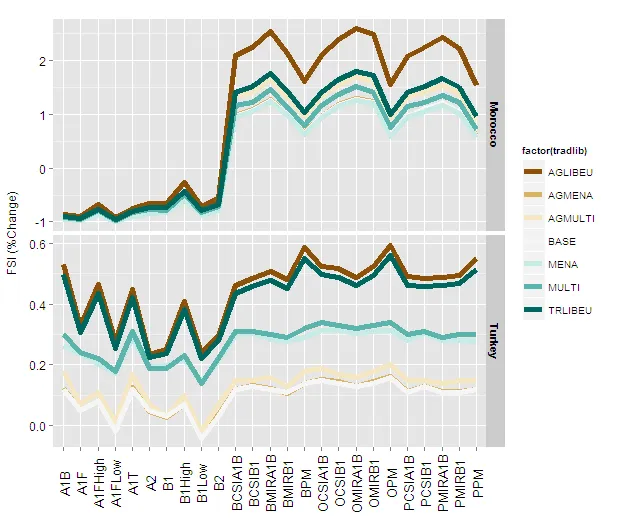
使用aes(size=2)的新结果:
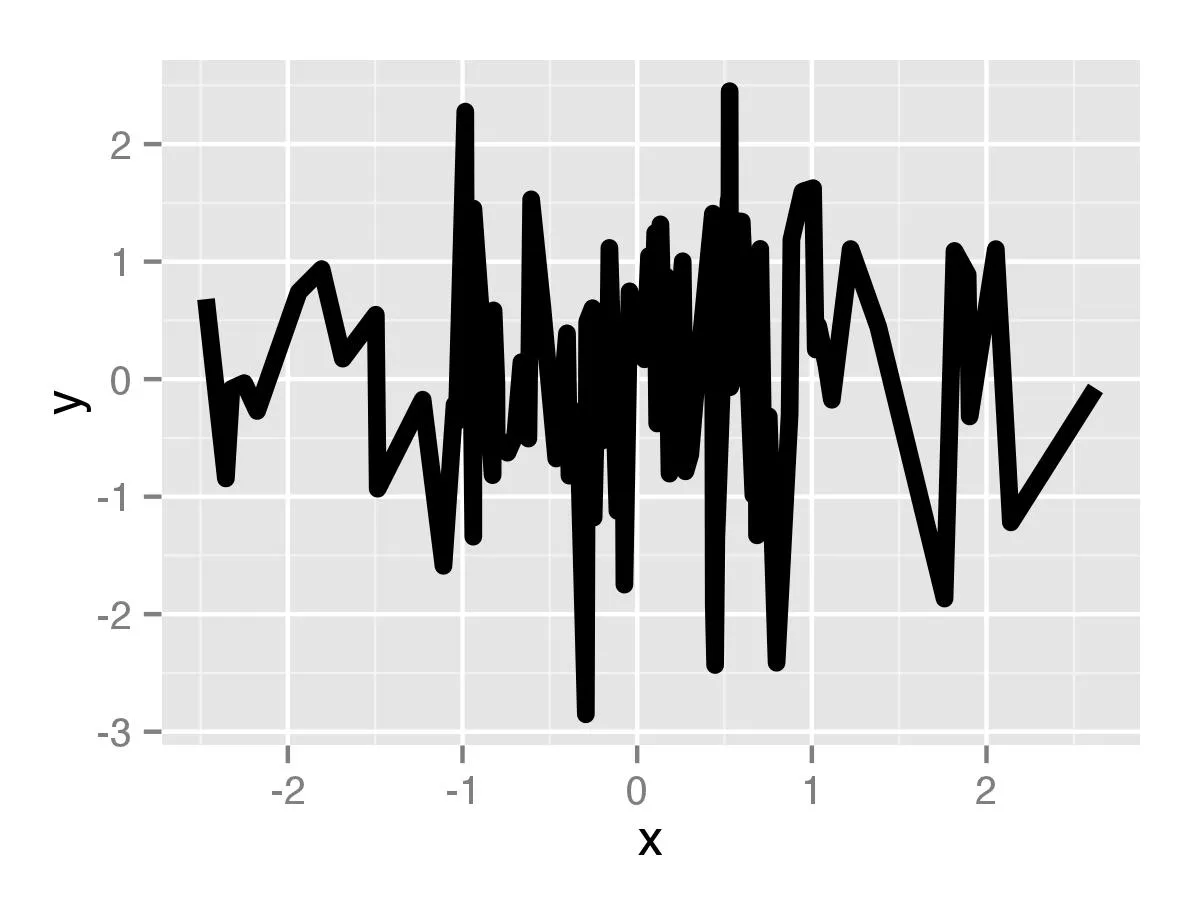
我的问题是: 是否有一种更精确地控制线条宽度以避免第二幅图中的结果的方法?我特别发现它不适合文档使用,对于包含新定义线条宽度的图形而言,在出版目的上更是如此。
最好的祝愿, ismail