test <- data.frame(
y=seq(18,41,1),
x=24:1
)
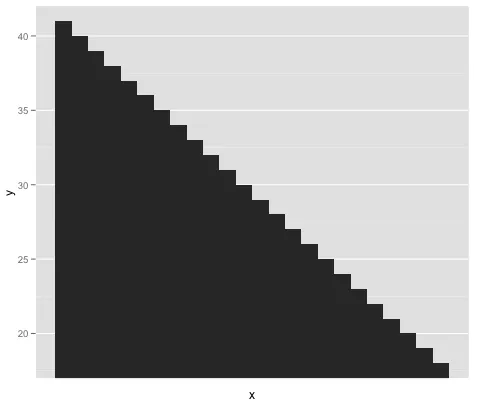
ggplot(test, aes(y=y, x=x)) + geom_bar(stat="identity", aes(width=1)) +
opts( axis.text.x = theme_blank(), axis.ticks.x = theme_blank()) +
scale_x_continuous(breaks=NULL) +
coord_cartesian(ylim = c(17, 42))
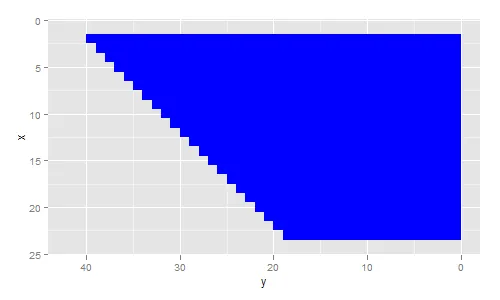
就旋转和翻转而言,我希望这个图中的y轴在顶部,x轴在右侧。因此,条形图从绘图区域的右侧“出来”,最长/最高的在顶部,最短的在底部。如果将其顺时针旋转90度,然后沿垂直线翻转,就可以实现这一点。
coord_flip()和scale_y_reverse()已经走了一段路。
编辑:
我想这已经很接近了,只需要将y轴放到图表的顶部。
ggplot(test, aes(y=y, x=x)) + geom_bar(stat="identity", aes(width=1)) +
    opts(axis.text.y = theme_blank(), axis.ticks.y = theme_blank()) +
    scale_x_continuous(breaks=NULL) + scale_y_reverse() + coord_flip()  + scale_x_reverse()