ggplot的geom_bar: 堆叠与居中

6

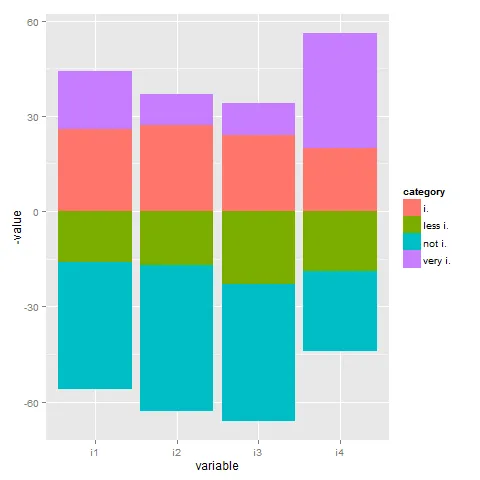
我有一个数据框,其中包含不同项的百分比股份,行表示回答不同类别的受访者的相应份额。 我想生成一个堆积条形图。

library(ggplot2)
library(reshape2)
 test<-data.frame(i1=c(16,40,26,18),
               i2=c(17,46,27,10),
               i3=c(23,43,24,10),
               i4=c(19,25,20,36))
 rownames(test)<-c("very i.","i.","less i.","not i.")

test.m<-melt(test)

ggplot(test.m, aes(x=variable, y=value, fill=value)) + 
   geom_bar(position="stack", stat="identity")

看起来还不错,但我想要:
a)把条形图居中:正面回答(非常赞同和赞同)向上,底部的两个类别(比较赞同和不赞同)向下。
b)每个类别(非常赞同、赞同、比较赞同、不赞同)都具有相同的颜色。

非常感谢您提供的任何帮助。

2个回答

12

使用类别名称作为分隔符比使用行名称更好:

test$category <- factor(c(3,4,2,1), labels=c("very i.","i.","less i.","not i."))

(因为叠加条形图而排序因子级别(最低: not i.,最高: very i.)。

test.m <- melt(test)

回答您的问题:

  1. 如果一些值高于零,而另一些值低于零,则堆叠条形图效果不佳。因此,创建两个单独的条形图(一个带有负值,一个带有正值)。
  2. 新列category用于fill参数,将每个类别映射到不同的颜色。

完整代码:

ggplot(test.m, aes(x=variable, fill=category)) + 
      geom_bar(data = subset(test.m, category %in% c("less i.","not i.")),
               aes(y = -value), position="stack", stat="identity") +
      geom_bar(data = subset(test.m, !category %in% c("less i.","not i.")), 
               aes(y = value), position="stack", stat="identity")

enter image description here


@sven-hohenstein,我似乎无法让它按我的意愿运行。请查看我的示例,其中正负y类别混淆了!你有什么想法吗? - geotheory
@geotheory 你应该反转颜色值的向量 (scale_fill_manual(values=rev(colorRampPalette(c('red','grey','green'))(4)))). - Sven Hohenstein
我不确定我的还是混乱的,只是颜色方案反了过来:http://gyazo.com/299436e3f68a77b431812dca8e175eff - geotheory
@geotheory,您想更改因子水平的顺序吗?levels(d$rating) <- c('bad','very_bad','good','very_good') - Sven Hohenstein

10
另一个专门为此目的设计的工具是HH包中的 likert()。这个实用的函数绘制出适用于Likert、语义差异和评分数据的分散堆积条形图。
library(HH)
# note use of t(test)[,4:1] to transpose and mirror dataframe for easy plotting
# test dataframe is otherwise unaltered from OP's question

likert(t(test)[,4:1], horizontal = FALSE,
       main = NULL, # or give "title",
       xlab = "Percent", # becomes ylab due to horizontal arg
       auto.key = list(space = "right", columns = 1,
                     reverse = TRUE))

这里输入图片描述

likert()的一个特别吸引人的功能是可以使用ReferenceZero参数将中性回应居中。(请注意它使用了适当的灰色来表示参考回应):

likert(t(test)[,4:1], horizontal=FALSE,
       main = NULL, # or give "title",
       xlab = "Percent", # becomes ylab due to horizontal arg
       ReferenceZero = 3,
       auto.key=list(space = "right", columns = 1,
                     reverse = TRUE))

以一个响应为中心的Likert数据

(这些示例通常使用垂直条,但是horizontal=TRUE通常更好,特别是如果想要包括问题或刻度名称。)


网页内容由stack overflow 提供, 点击上面的
可以查看英文原文,
原文链接