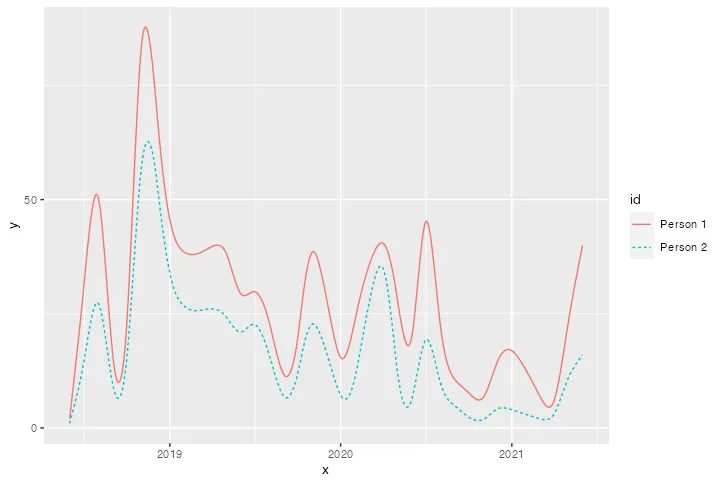
我很长时间以来一直在试图调整我的绘图(ggplot2)中x轴的标签。挑战在于我有两个geom_paths,每个都从不同的数据框中获取数据 - 我相信这在代码中会变得更加清晰:
ggplot(data=dx, aes(x = year, y=en.x ))+
  scale_y_continuous(breaks = scales::pretty_breaks(n = 2))+
  geom_path(data=ps, aes(x, y, color = "Person 1", linetype="Person 1"), size=0.5)+
  geom_path(data=pg, aes(x , y, color = "Person 2", linetype="Person 2"), size=0.5)+
  scale_color_manual("",labels = c(Nutzer1, Nutzer2), values = c("Person 1" = Nutzer1Farbe, "Person 2" = Nutzer2Farbe)) +
  scale_linetype_manual("",labels = c(Nutzer1, Nutzer2), values=c("Person 1"=Nutzer1Format, "Person 2"=Nutzer2Format))
目标是使用数据框“dx”中的年份来标记X轴,如aes参数所示。这样做是有效的!但只有在禁用geom_paths时才有效-如下所示:
ggplot(data=dx, aes(x = year, y=en.x ))+
  scale_y_continuous(breaks = scales::pretty_breaks(n = 2))+
  #geom_path(data=ps, aes(x, y, color = "Person 1", linetype="Person 1"), size=0.5)+
  #geom_path(data=pg, aes(x , y, color = "Person 2", linetype="Person 2"), size=0.5)+
  scale_color_manual("",labels = c(Nutzer1, Nutzer2), values = c("Person 1" = Nutzer1Farbe, "Person 2" = Nutzer2Farbe)) +
  scale_linetype_manual("",labels = c(Nutzer1, Nutzer2), values=c("Person 1"=Nutzer1Format, "Person 2"=Nutzer2Format))
我真的不太理解为什么路径会破坏这样的标签 - 这一定是aes参数造成的。
如果有人有解决办法,我将非常感激!
xspline(datengesamt[,2:2], shape=0.9, lwd=2, draw=F)。无论如何,请尝试将您的年份分配给数字或日期格式。 - Pedro Alencar