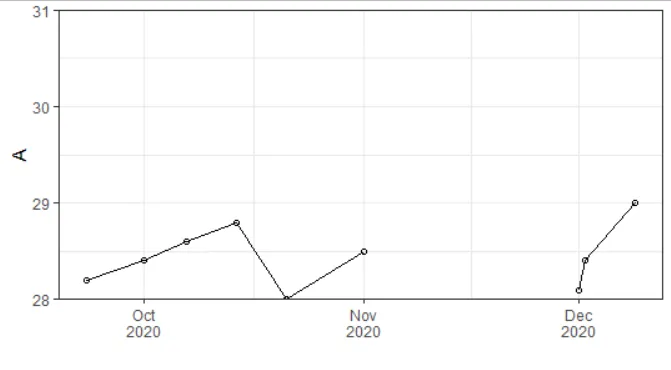
我想为我的图表创建一个两级x轴标签。首先在刻度附近显示月份,然后在下方显示年份。这是我的脚本:
Date <- c(2020-09-07,2020-09-14,2020-09-21,2020-09-28,2020-10-07,2020-10-14,2020-10-21,2020-10-28,2020-11-07,2020-11-14,2020-11-21,2020-1-28)
A <- c(28.2,28.4,28.6,28.8,28,28.5,27.6,27.9,27.9,28.1,28.4,29)

test<-data.frame(Date,A)

test$Date <- as.Date(test$Date, origin = "2020-09-07")

ggplot(test, aes(x=Date, y=A))+
  geom_line(na.rm=TRUE)+
  xlab("") + ylab("A")+
  (scale_x_date(breaks=date_breaks("1 month"),labels=date_format("%b")))+
  scale_y_continuous(expand = c(0, 0), limits = c(26, 31))+
  theme_bw()
它只显示标签的月份。我想在x轴下面创建另一条线,它将显示与相应月份对齐的年份。
dput()分享一下这部分数据吗?这样任何想要帮助你的人都会更容易。 - Shibaprasadb