我知道hjust用于x title轴,但是如何使x轴标签居中且支持多行?这是我的绘图函数:
gg_fun<-function(){
  ggplot(tab,
         aes(x = Var1, y = Percent)) +
    #theme_light() +
    theme(panel.background = element_rect(fill = NA),
          axis.title.y=element_text(angle=0, vjust=0.5, face="bold"),
          axis.title.x=element_blank(),
          axis.text.y = element_text(size = 10),
          axis.text.x = element_text(size = 12),
          axis.ticks.x = element_blank(),
          axis.ticks.y = element_blank(),
          #panel.grid.minor = element_line(colour = "dark gray"),
          panel.grid.major.x = element_blank() ,
          # explicitly set the horizontal lines (or they will disappear too)
          panel.grid.major.y = element_line(size=.1, color="dark gray" ),
          axis.line = element_line(size=.1, colour = "black"),
          plot.background = element_rect(colour = "black",size = 1)) +
    geom_bar(stat = "Identity", fill="#5596E6") + #"cornflower" blue
    ggtitle(element_blank()) +
    scale_y_continuous(expand =  c(0, 0), breaks = round(seq(0, 1, by = .1), digits = 2),
                       labels  = percent(round(seq(0, 1, by = .1), digits = 2), digits = 0),
                       limits = c(0,.6)) #+
    #scale_x_discrete()
}
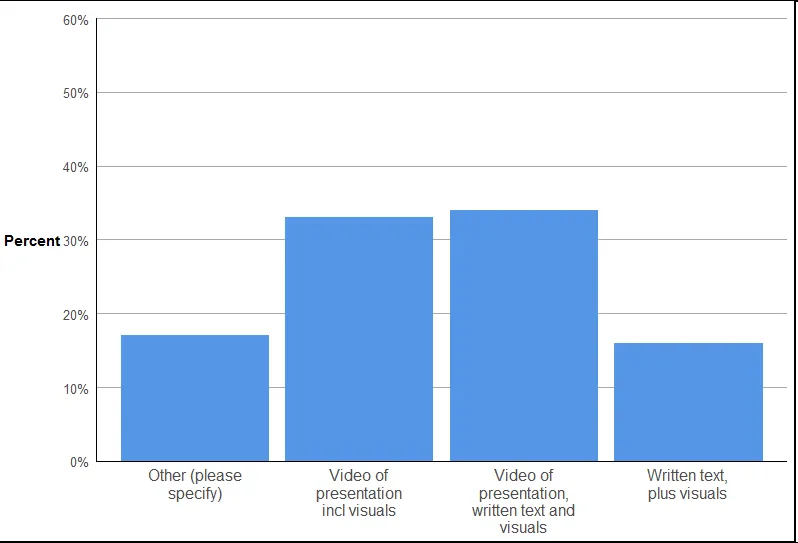
这里是一个示例图表:
我知道scale_x_discrete()的n.dodge参数,但这不是我想要的。我也不想仅仅使用labels = abbreviate或者精确指定,因为这很费时间。例如,我还看到过这样的方法:levels(birds$effect) <- gsub(" ", "\n", levels(birds$effect)),但这种方法跳过了每一行,并使一些标签变得太长。如何让x轴文本居中并多行显示以防止重叠?以下是我想要的示例: