在ggplot中有两行X轴标签

4

我想在ggplot中让X轴标签显示两行。

enter image description here

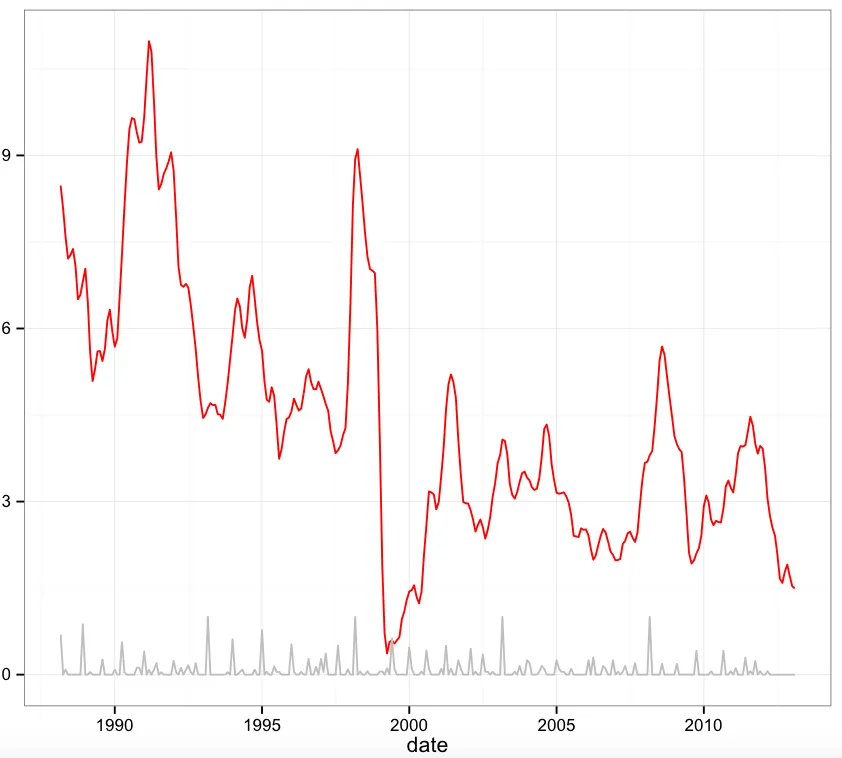
在这个图表中,我想在每个指定年份下面再添加一行标签。类似于

1990 1995 2000 2005 2010 冷暖 暖和 暖和 冷 暖和

这是我用来制作此图的代码:

ggplot(subset(dat, countryid %in% c("1")),  aes(date, 
nonpartisan))+geom_line(aes(color=countryid), color="dodgerblue1", 
size=1.4)+geom_line(aes(date, reshuffle), color="gray")+ theme_bw()

有没有办法通过创建专门用于标签的列来增加一行标签? 谢谢!

可能是 ggplot折线图中多行x轴标签的重复问题。 - Henrik
1个回答

14

您可以通过scale_x_continuous(如果实际上是Date格式,则为scale_x_date)添加自定义标签。

ggplot(subset(dat, countryid %in% c("1")),  aes(date, nonpartisan)) +
  geom_line(aes(color=countryid), color="dodgerblue1", size=1.4) +
  geom_line(aes(date, reshuffle), color="gray") + 
  theme_bw() +
  scale_x_continuous(name = 'date', 
                     breaks = c('1990', '1995', '2000', '2005', '2010'), 
                     labels = c('1990\ncold', '1995\nwarm', '2000\nwarm', '2005\ncold', '2010\nwarm'))

谢谢!这个完美地运行了。我只是将你的代码从scale_x_continuous修改为scale_x_date。还进行了一些小的调整以适应日期格式。 - user3077008
@user3077008,你能发布一下你的代码吗?谢谢。 - Sergio

网页内容由stack overflow 提供, 点击上面的
可以查看英文原文,
原文链接