创建直方图时考虑误差的影响

5
我有一组 N 个观测值,分布在二维空间中的点 (x[i], y[i]), i=0..N。每个点都有两个坐标的误差 (e_x[i], e_y[i], i=0..N),并且还有一个附加的权重 (w[i], i=0..N)。
我想生成这些 N 个点的二维直方图,不仅考虑权重,还要考虑误差,如果误差值足够大(假设误差符合标准高斯分布,尽管可能考虑其他分布),则会使每个点在许多箱子之间分散
我发现 numpy.histogram2d 有一个 weights 参数,因此已经解决了这个问题。问题在于如何考虑每个观察点的误差。

有没有函数可以让我这样做?我接受 numpyscipy 中的任何函数。


这些错误值代表什么?这些是沿主轴的标准偏差吗? - user1415946
好的,该参数集构成了一个多元高斯混合模型,给定权重(\pi_i),样本作为均值(\mu_i)和协方差矩阵(\Sigma_i)由[[e_x [i] ** 2,0] [0,e_y [i] ** 2]]给出。与您假设的标准正态情况不同(对应于所有e_x和e_y都等于1.0),您具有对角线可以具有不同值的协方差矩阵。这对应于沿主轴具有主轴的椭圆,而不是圆形。这有助于您继续前进吗? - user1415946
1个回答

1
建立在user1415946的评论基础上,你可以假设每个点代表一个双变量正态分布,其协方差矩阵由
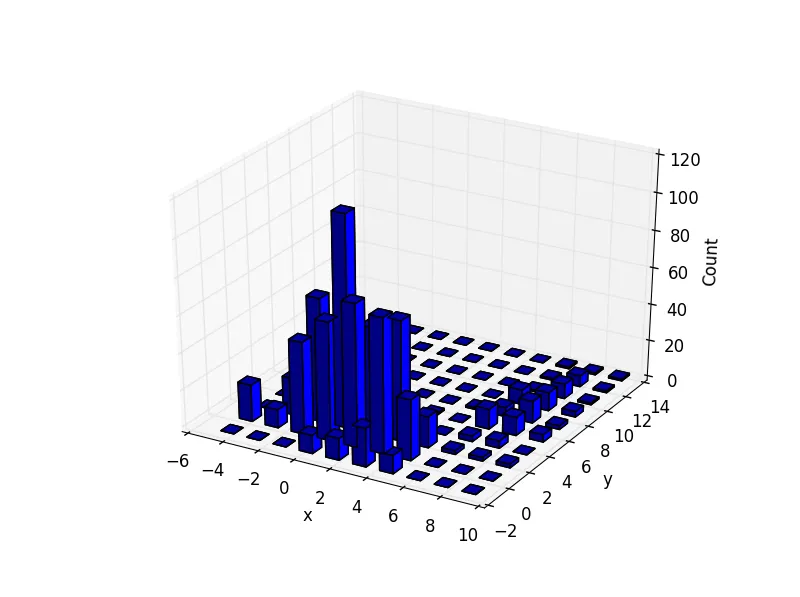
[[e_x[i]**2,0][0,e_y[i]**2]]给出。但是,所得到的分布不是正态分布 - 在运行示例后,你会发现直方图根本不像高斯分布,而是一组它们。
创建此分布集合的直方图的一种方法是使用numpy.random.multivariate_normal从每个点生成随机样本。看下面的示例代码,其中包含一些人工数据。
import numpy as np
from mpl_toolkits.mplot3d import Axes3D
import matplotlib.pyplot as plt


# This is a function I like to use for plotting histograms
def plotHistogram3d(hist, xedges, yedges):
    fig = plt.figure()
    ax = fig.add_subplot(111, projection='3d')
    hist = hist.transpose()
    # Transposing is done so that bar3d x and y match hist shape correctly
    dx = np.mean(np.diff(xedges))
    dy = np.mean(np.diff(yedges))

    # Computing the number of elements
    elements = (len(xedges) - 1) * (len(yedges) - 1)
    # Generating mesh grids.
    xpos, ypos = np.meshgrid(xedges[:-1]+dx/2.0, yedges[:-1]+dy/2.0)

    # Vectorizing matrices
    xpos = xpos.flatten()
    ypos = ypos.flatten()
    zpos = np.zeros(elements)
    dx = dx * np.ones_like(zpos) * 0.5  # 0.5 factor to give room between bars.
# Use 1.0 if you want all bars 'glued' to each other
    dy = dy * np.ones_like(zpos) * 0.5
    dz = hist.flatten()

    ax.bar3d(xpos, ypos, zpos, dx, dy, dz, color='b')
    ax.set_xlabel('x')
    ax.set_ylabel('y')
    ax.set_zlabel('Count')
    return

"""
INPUT DATA
"""
#                 x  y ex ey  w
data = np.array([[1, 2, 1, 1, 1],
                 [3, 0, 1, 1, 2],
                 [0, 1, 2, 1, 5],
                 [7, 7, 1, 3, 1]])

"""
Generate samples
"""
# Sample size (100 samples will be generated for each data point)
SAMPLE_SIZE = 100
# I want to fill in a table with columns [x, y, w]. Each data point generates SAMPLE_SIZE
# samples, so we have SAMPLE_SIZE * (number of data points) generated points
points = np.zeros((SAMPLE_SIZE * data.shape[0], 3))  # Initializing this matrix

for i, element in enumerate(data):  # For each row in the data set
    meanVector = element[:2]
    covarianceMatrix = np.diag(element[2:4]**2)  # Diagonal matrix with elements equal to error^2
    # For columns 0 and 1, add generated x and y samples
    points[SAMPLE_SIZE*i:SAMPLE_SIZE*(i+1), :2] = \
        np.random.multivariate_normal(meanVector, covarianceMatrix, SAMPLE_SIZE)
    # For column 2, simply copy original weight
    points[SAMPLE_SIZE*i:SAMPLE_SIZE*(i+1), 2] = element[4]  # weights

hist, xedges, yedges = np.histogram2d(points[:, 0], points[:, 1], weights=points[:, 2])
plotHistogram3d(hist, xedges, yedges)
plt.show()

下面绘制的结果如下:

enter image description here


Gabriel,请问你能否在你的示例代码中添加一些注释,描述每行代码的作用呢?另外,请问你正在运行哪个版本的 matplotlib?我正在使用 1.3.1 版本并尝试运行你的示例代码,但会出现 ValueError: Unknown projection '3d' 的错误提示;这很奇怪,因为这里 https://dev59.com/LW865IYBdhLWcg3wceNU 给出的示例可以正常运行,没有任何问题。 - Gabriel
1
我使用的是和你一样的版本,但是在回答之前我误删了一个导入行。这个应该可以工作了。谢谢。 - Gabriel Gleizer

网页内容由stack overflow 提供, 点击上面的
可以查看英文原文,
原文链接