我想绘制带有点和误差条的直方图,而不是条形或阶梯状直方图。这个可行吗?谷歌没有帮助到我,我希望你可以。同时它不应该被标准化。谢谢!
2个回答
2
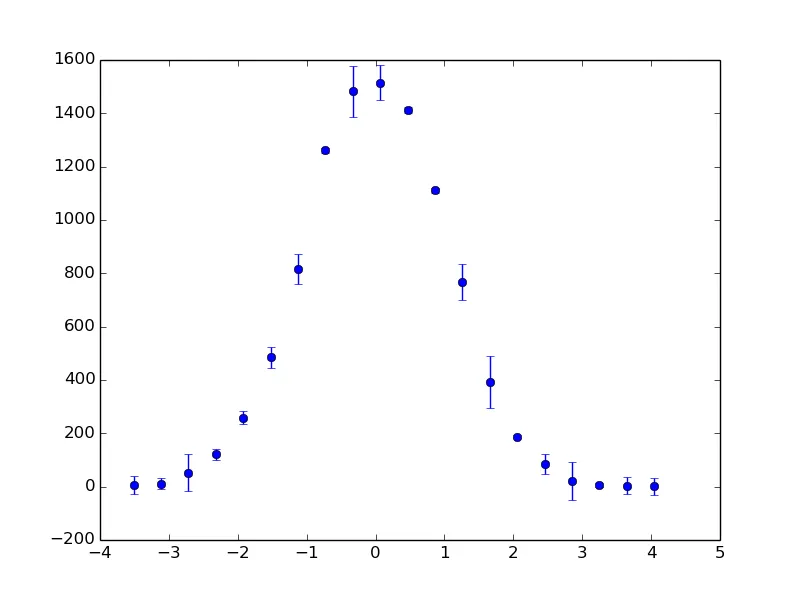
假设您正在使用numpy和matplotlib,您可以使用 np.histogram() 获取条形图的边缘和计数,然后使用 pp.errorbar() 绘制它们:
import numpy as np
from matplotlib import pyplot as pp

x = np.random.randn(10000)
counts,bin_edges = np.histogram(x,20)
bin_centres = (bin_edges[:-1] + bin_edges[1:])/2.
err = np.random.rand(bin_centres.size)*100
pp.errorbar(bin_centres, counts, yerr=err, fmt='o')

pp.show()
我不确定你所说的“归一化”是什么意思,但例如可以通过将计数除以值的总数来轻松实现直方图总和为1。
对我而言,更重要的问题是,在处理每个区间的绝对计数时,误差棒实际上代表什么意义。
- ali_m
0
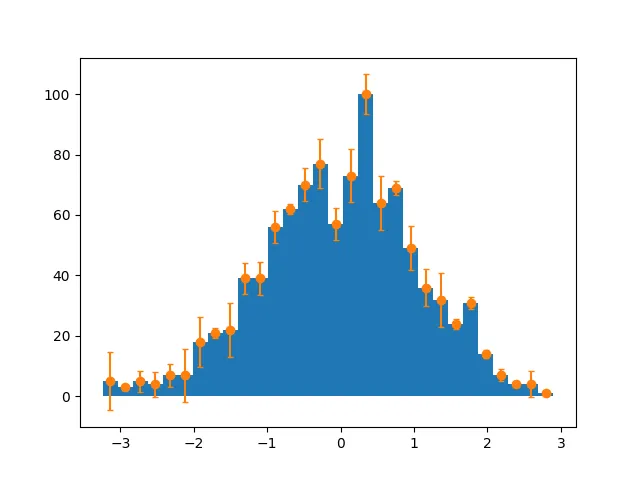
你也可以使用纯Matplotlib来完成这个操作,使用matplotlib.pyplot.hist绘制直方图。
import numpy as np               # Only used to generate the data
import matplotlib.pyplot as plt

x = np.random.randn(1000)

plt.figure()

# Matplotlib's pyplot.hist returns the bin counts, bin edges,
# and the actual rendered blocks of the histogram (which we don't need)
bin_counts, bin_edges, patches = plt.hist(x, bins=30)
bin_centres = (bin_edges[:-1] + bin_edges[1:]) / 2

# Generate some dummy error values, of the same dimensions as the bin counts
y_error = np.random.rand(bin_counts.size)*10

# Plot the error bars, centred on (bin_centre, bin_count), with length y_error
plt.errorbar(x=bin_centres, y=bin_counts,
             yerr=y_error, fmt='o', capsize=2)

plt.show()
- theo-brown
网页内容由stack overflow 提供, 点击上面的可以查看英文原文,
原文链接
原文链接