有没有一种方法可以做到这一点?我似乎找不到一种简单的方法将pandas序列与绘制CDF相接口。
11个回答
95
我认为你要查找的功能在Series对象的hist方法中,该方法包装了matplotlib的hist()函数。
这里是相关文档。
In [10]: import matplotlib.pyplot as plt

In [11]: plt.hist?
...
Plot a histogram.

Compute and draw the histogram of *x*. The return value is a
tuple (*n*, *bins*, *patches*) or ([*n0*, *n1*, ...], *bins*,
[*patches0*, *patches1*,...]) if the input contains multiple
data.
...
cumulative : boolean, optional, default : False
    If `True`, then a histogram is computed where each bin gives the
    counts in that bin plus all bins for smaller values. The last bin
    gives the total number of datapoints.  If `normed` is also `True`
    then the histogram is normalized such that the last bin equals 1.
    If `cumulative` evaluates to less than 0 (e.g., -1), the direction
    of accumulation is reversed.  In this case, if `normed` is also
    `True`, then the histogram is normalized such that the first bin
    equals 1.

...
In [12]: import pandas as pd

In [13]: import numpy as np

In [14]: ser = pd.Series(np.random.normal(size=1000))

In [15]: ser.hist(cumulative=True, density=1, bins=100)
Out[15]: <matplotlib.axes.AxesSubplot at 0x11469a590>

In [16]: plt.show()
- Dan Frank
2
1有没有一种方法只获取步进函数而不填充条形图? - wolfsatthedoor
9
histtype='step'是pyplot.hist文档中的一个参数,上面的文档进行了截断。 - Dan Frank53
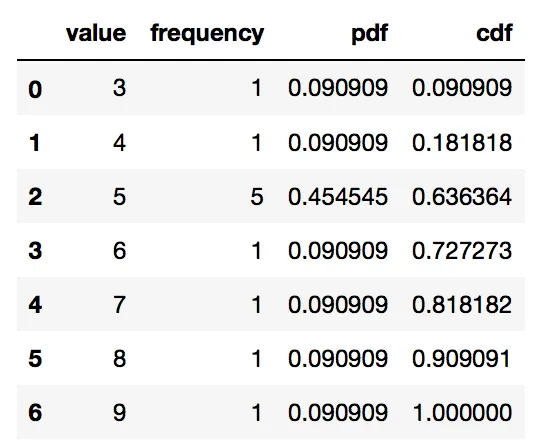
如果您对数值也感兴趣,而不仅仅是图表。
import pandas as pd

# If you are in jupyter
%matplotlib inline
这将始终有效(离散和连续分布)
# Define your series
s = pd.Series([9, 5, 3, 5, 5, 4, 6, 5, 5, 8, 7], name = 'value')
df = pd.DataFrame(s)
# Get the frequency, PDF and CDF for each value in the series

# Frequency
stats_df = df \
.groupby('value') \
['value'] \
.agg('count') \
.pipe(pd.DataFrame) \
.rename(columns = {'value': 'frequency'})

# PDF
stats_df['pdf'] = stats_df['frequency'] / sum(stats_df['frequency'])

# CDF
stats_df['cdf'] = stats_df['pdf'].cumsum()
stats_df = stats_df.reset_index()
stats_df
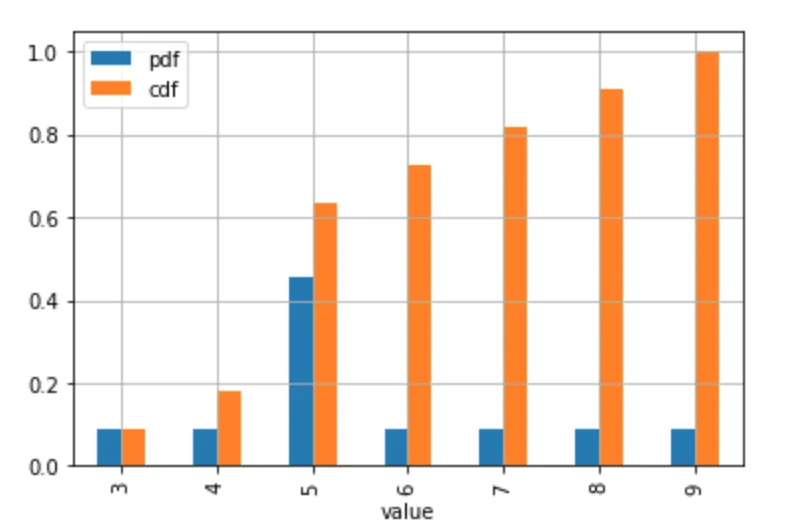
# Plot the discrete Probability Mass Function and CDF.
# Technically, the 'pdf label in the legend and the table the should be 'pmf'
# (Probability Mass Function) since the distribution is discrete.

# If you don't have too many values / usually discrete case
stats_df.plot.bar(x = 'value', y = ['pdf', 'cdf'], grid = True)
如果你从连续分布中取样或者有很多个体值,可以使用另一种示例:
# Define your series
s = pd.Series(np.random.normal(loc = 10, scale = 0.1, size = 1000), name = 'value')
# ... all the same calculation stuff to get the frequency, PDF, CDF
# Plot
stats_df.plot(x = 'value', y = ['pdf', 'cdf'], grid = True)

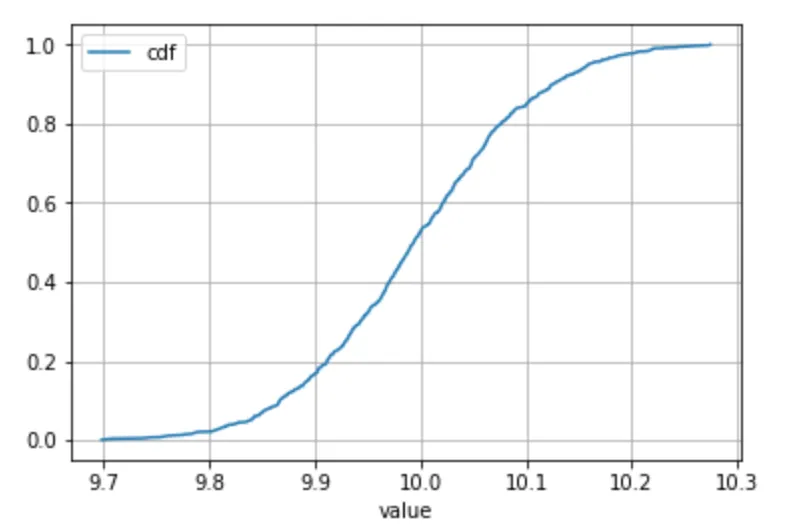
仅适用于连续分布
请注意,如果合理假设样本中每个值只出现一次(通常在连续分布的情况下遇到),则不需要使用groupby()+agg('count') (因为计数始终为1)。
在这种情况下,可以使用百分位排名直接得到累积分布函数。
在采取此类捷径时,请谨慎判断!:)
# Define your series
s = pd.Series(np.random.normal(loc = 10, scale = 0.1, size = 1000), name = 'value')
df = pd.DataFrame(s)
# Get to the CDF directly
df['cdf'] = df.rank(method = 'average', pct = True)
# Sort and plot
df.sort_values('value').plot(x = 'value', y = 'cdf', grid = True)
- Raphvanns
4
2这个答案非常详细和有帮助。 - Manoel Vilela
1这确实很有帮助。谢谢! - heisenberg_0120
我该如何定义此答案中的箱数? - MrT77
1这里没有需要定义的bins。如果你在想这是直方图,那也不是。 - Raphvanns
19
我来到这里寻找带有条形图和累积分布函数线的图表:
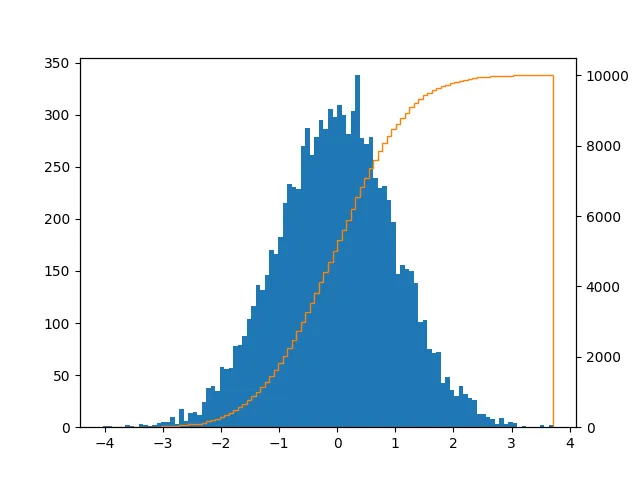
可以通过以下方式实现:
import pandas as pd
import numpy as np
import matplotlib.pyplot as plt
series = pd.Series(np.random.normal(size=10000))
fig, ax = plt.subplots()
ax2 = ax.twinx()
n, bins, patches = ax.hist(series, bins=100, normed=False)
n, bins, patches = ax2.hist(
    series, cumulative=1, histtype='step', bins=100, color='tab:orange')
plt.savefig('test.png')
如果您想要移除垂直线,那么可以在这里找到实现方法。或者您也可以直接执行以下操作:
ax.set_xlim((ax.get_xlim()[0], series.max()))
我在这里看到了一个优雅的解决方案here,可以使用seaborn实现。
- tommy.carstensen
2
也许第二个轴应该使用百分比(在0-1之间)。 - skibee
@skibee 这是一个好建议。请随意编辑答案。 - tommy.carstensen
16
CDF(累积分布函数)图表基本上是一个图表,其中X轴上是排序后的值,Y轴上是累积分布。因此,我将创建一个新序列,用排序后的值作为索引,用累积分布作为值。
首先创建一个示例序列:
import pandas as pd
import numpy as np
ser = pd.Series(np.random.normal(size=100))
对这个系列进行排序:
ser = ser.sort_values()
现在,在继续之前,再次添加最后一个(也是最大的)值。这一步对于小样本大小尤其重要,以便获得无偏的CDF:
ser[len(ser)] = ser.iloc[-1]
使用排序后的值作为索引,累积分布作为值创建一个新的系列:
cum_dist = np.linspace(0.,1.,len(ser))
ser_cdf = pd.Series(cum_dist, index=ser)
最后,将该函数绘制为阶梯图:
ser_cdf.plot(drawstyle='steps')
- kadee
3
7为什么需要添加最后一个值? - Patrick Collins
1
order已被弃用,请使用ser.sort_values()。 - Lukas@kadee
ser[len(ser)] = ser.iloc[-1] 在 pandas 0.19 上不起作用。 - jlandercy14
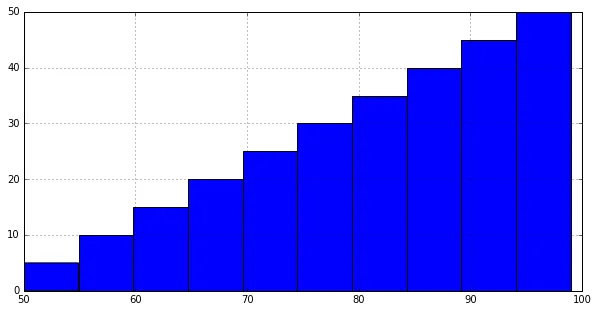
这是最简单的方法。
import pandas as pd
df = pd.Series([i for i in range(100)])
df.hist( cumulative = True )
- wroscoe
7
我在“纯”Pandas中找到了另一种解决方案,它不需要指定直方图中要使用的箱子数量:
import pandas as pd
import numpy as np # used only to create example data

series = pd.Series(np.random.normal(size=10000))

cdf = series.value_counts().sort_index().cumsum()
cdf.plot()
- jk.
1
2不错的回答!但是cdf应该从0到1;我会改成
cdf=series.value_counts().sort_index().cumsum() / series.shape[0]。 - Itamar Mushkin3
升级@wroscoe的答案
df[your_column].plot(kind = 'hist', histtype = 'step', density = True, cumulative = True)
您还可以提供所需的箱数。
- Simon Osadchii
2
对我来说,这似乎是一个简单的方法:
import numpy as np
import pandas as pd
import matplotlib.pyplot as plt

heights = pd.Series(np.random.normal(size=100))

# empirical CDF
def F(x,data):
    return float(len(data[data <= x]))/len(data)

vF = np.vectorize(F, excluded=['data'])

plt.plot(np.sort(heights),vF(x=np.sort(heights), data=heights))
- annon
1
我非常喜欢Raphvanns的答案。它很有帮助,因为它不仅产生了绘图,而且还帮助我理解了pdf、cdf和ccdf是什么。
我有两件事要添加到Raphvanns的解决方案中:(1)明智地使用
生成随机数:
按照Raphvanns的建议构建一个数据框:
剧情:
这是情节:
如果您采用降序排列,您可以想象CDF和CCDF将互换位置:
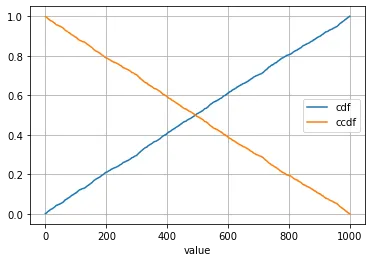
我有两件事要添加到Raphvanns的解决方案中:(1)明智地使用
collections.Counter使过程更容易;(2)在计算pdf、cdf和ccdf之前记得对value进行排序(升序)。import pandas as pd
import numpy as np
import matplotlib.pyplot as plt
from collections import Counter
生成随机数:
s = pd.Series(np.random.randint(1000, size=(1000)))
按照Raphvanns的建议构建一个数据框:
dic = dict(Counter(s))
df = pd.DataFrame(s.items(), columns = ['value', 'frequency'])
Calculate PDF, CDF, and CCDF:
df['pdf'] = df.frequency/sum(df.frequency)
df['cdf'] = df['pdf'].cumsum()
df['ccdf'] = 1-df['cdf']
剧情:
df.plot(x = 'value', y = ['cdf', 'ccdf'], grid = True)
value进行排序。好吧,假设我们不对它们进行排序,结果会怎样呢?(请注意,dict(Counter(s))自动排序了项目,以下我们将使顺序随机。)dic = dict(Counter(s))
df = pd.DataFrame(s.items(), columns = ['value', 'frequency'])
# randomize the order of `value`:
df = df.sample(n=1000)
df['pdf'] = df.frequency/sum(df.frequency)
df['cdf'] = df['pdf'].cumsum()
df['ccdf'] = 1-df['cdf']
df.plot(x = 'value', y = ['cdf'], grid = True)
这是情节:
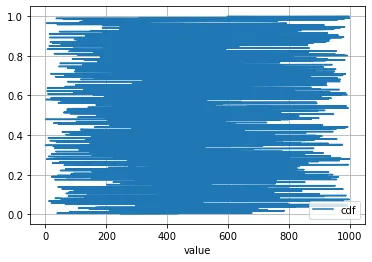
value的顺序未排序(升序或降序均可),那么当你绘制图表时,当x轴按升序排列时,y值当然会混乱无序。如果您采用降序排列,您可以想象CDF和CCDF将互换位置:
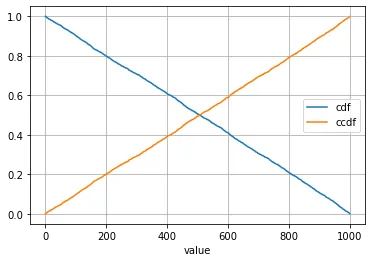
value,在计算PDF、CDF和CCDF之后(而不是之前)对value进行排序,是否能解决问题?dic = dict(Counter(s))
df = pd.DataFrame(s.items(), columns = ['value', 'frequency'])
# randomize the order of `value`:
df = df.sample(n=1000)
df['pdf'] = df.frequency/sum(df.frequency)
df['cdf'] = df['pdf'].cumsum()
df['ccdf'] = 1-df['cdf']
# Will this solve the problem?
df = df.sort_values(by='value')
df.plot(x = 'value', y = ['cdf'], grid = True)
- Hongtao Hao
1
它不必太复杂。所需的只是:
import matplotlib.pyplot as plt
import numpy as np

x = series.dropna().sort_values()
y = np.linspace(0, 1, len(x))
plt.plot(x, y)
- Michel de Ruiter
网页内容由stack overflow 提供, 点击上面的可以查看英文原文,
原文链接
原文链接
- 相关问题
- 32 如何在Python的matplotlib中绘制累积分布函数(CDF)?
- 9 绘制Pandas Series数据的平滑曲线
- 7 Python Pandas Series 失败日期时间
- 4 在Pandas Series中重命名索引?
- 3 用另一个以时间戳为索引的 Pandas series 覆盖 Python Pandas series。
- 3 如何在R中绘制CDF
- 9 Python中读取文件并绘制CDF
- 83 在Python Pandas中从另外两个Series创建逐元素最小值Series
- 7 Python - pandas - 将Series添加到空DataFrame中
- 4 在绘制两个Pandas Series之后,在matplotlib中创建图例
pandas的领域之内。使用 seaborn 的kdeplot并将cumulative=True。 - TomAugspurger