如何在R中绘制CDF

3

我正在尝试使用ecdf()函数绘制一个CDF图,以下是代码:

> x<-ecdf(data$V6)

> summary(x)
 Empirical CDF:   2402 unique values with summary
 Min.   1st Qu.    Median      Mean   3rd Qu.      Max. 
 3392     71870    120100    386100    219000 158600000 
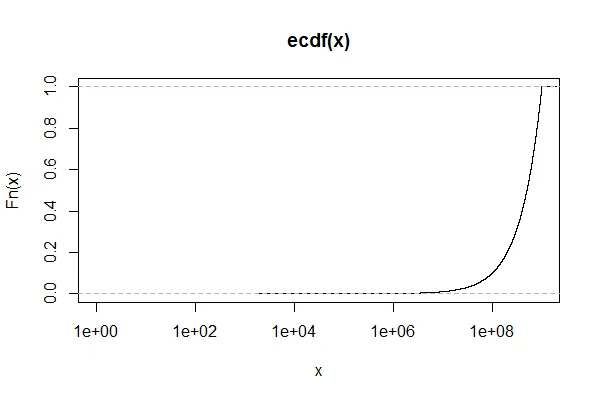
plot(x, log='x')
    Error in plot.window(...) : Logarithmic axis must have positive limits

我的数据集呈指数增长,因此我希望在x轴上使用对数刻度。当我不使用 log="x" 时,它可以工作,但绘图效果不好。我需要x轴是对数的,有什么办法吗?


顺便说一句,我尝试添加 xlim=c(0,158600000) 但是出现了另一个错误:nonfinite axis limits [GScale(-inf,8.2003,1, .); log=1] - Nasir
1个回答

11

这里有一些可以重现你问题的代码:

x <- seq(2e3, 1e9, length.out=2000)
ex <- ecdf(x)
plot(ex, log="x")
Error in plot.window(...) : Logarithmic axis must have positive limits

现在,将绘图限制设置为c(0, 1e9)

plot(ex, xlim=c(0, 1e9), log="x")
Warning message:
In plot.window(...) : nonfinite axis limits [GScale(-inf,9,1, .); log=1]
Warning messages:
1: nonfinite axis limits [GScale(-inf,9,1, .); log=1] 
2: nonfinite axis limits [GScale(-inf,9,1, .); log=1] 

解决方案: 将xlim设置为c(1, 1e9),即将下限设置为一个正数:

plot(ex, xlim=c(1, 1e9), log="x")

在此输入图片描述


网页内容由stack overflow 提供, 点击上面的
可以查看英文原文,
原文链接