您可以看到下面有一个直方图。
它是这样创建的:
如何缩放直方图?
例如,让直方图的高度只有现在的三分之一。
此外,是否有方法可以删除左侧的垂直线?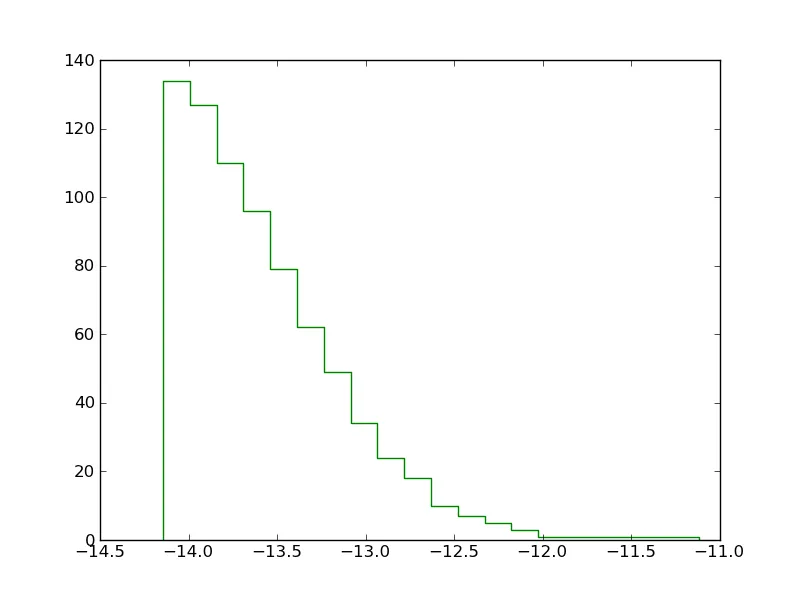
它是这样创建的:
pl.hist(data1,bins=20,color='green',histtype="step",cumulative=-1)如何缩放直方图?
例如,让直方图的高度只有现在的三分之一。
此外,是否有方法可以删除左侧的垂直线?