有没有一种方法可以做到这一点?我似乎找不到一种简单的方法将pandas序列与绘制CDF相接口。
11个回答
0
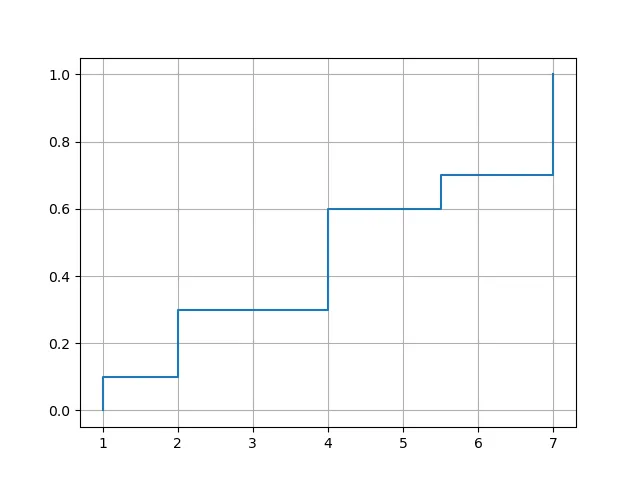
如果您想绘制一个“真实”的经验CDF,它在数据集a的值处准确跳跃,并且每个值的跳跃比例与该值的频率成正比,NumPy具有内置函数来完成这项工作:
import matplotlib.pyplot as plt
import numpy as np

def ecdf(a):
    x, counts = np.unique(a, return_counts=True)
    y = np.cumsum(counts)
    x = np.insert(x, 0, x[0])
    y = np.insert(y/y[-1], 0, 0.)
    plt.plot(x, y, drawstyle='steps-post')
    plt.grid(True)
    plt.savefig('ecdf.png')
unique() 的调用会按照已排序的顺序返回数据值及其相应频率。在 plot() 调用中使用选项 drawstyle='steps-post',确保跳跃发生在正确位置。为了在最小数据值处强制进行跳跃,代码在 x 和 y 前面插入了一个额外的元素。
用法示例:
xvec = np.array([7,1,2,2,7,4,4,4,5.5,7])
ecdf(xvec)
另一种用法:
df = pd.DataFrame({'x':[7,1,2,2,7,4,4,4,5.5,7]})
ecdf(df['x'])
输出结果为:
- grand_chat
网页内容由stack overflow 提供, 点击上面的可以查看英文原文,
原文链接
原文链接
- 相关问题
- 32 如何在Python的matplotlib中绘制累积分布函数(CDF)?
- 9 绘制Pandas Series数据的平滑曲线
- 7 Python Pandas Series 失败日期时间
- 4 在Pandas Series中重命名索引?
- 3 用另一个以时间戳为索引的 Pandas series 覆盖 Python Pandas series。
- 3 如何在R中绘制CDF
- 9 Python中读取文件并绘制CDF
- 83 在Python Pandas中从另外两个Series创建逐元素最小值Series
- 7 Python - pandas - 将Series添加到空DataFrame中
- 4 在绘制两个Pandas Series之后,在matplotlib中创建图例
pandas的领域之内。使用 seaborn 的kdeplot并将cumulative=True。 - TomAugspurger