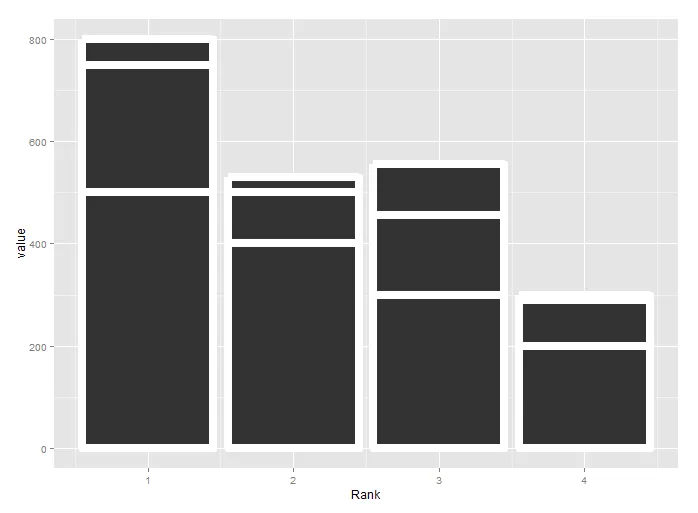
这是我能够接近你的示例图的最佳匹配。它并没有比你已经整理好的图像有多大的改进,但是对灰色背景上的白色条形边框的强调更少。
library(ggplot2)
p <- ggplot(DF1, aes(x = Rank, y = value, group = variable))
p <- p + geom_bar(stat = "identity", position = "stack", lwd = 1.5,
                  width = 0.5, colour = "white", fill = "black")
p <- p + theme_classic()
p <- p + theme(axis.text.x = element_text(angle = 90, vjust = 0.5))
p
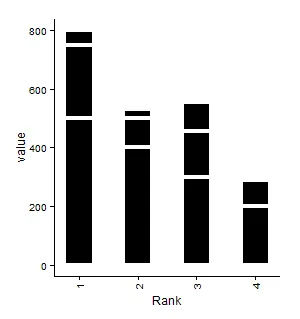
那将产生以下结果:
如果您想保留灰色背景,可以找出确切的灰色阴影,并在去除背景网格的同时使用该颜色作为线条颜色(但这不是正确的阴影)。
p <- ggplot(DF1, aes(x = Rank, y = value))
p <- p + geom_bar(stat = "identity", position = "stack", lwd = 1.5,
                  width = 0.5, colour = "grey", fill = "black")
p <- p + theme(panel.grid = element_blank())
p
这种解决方案的问题在于非常小的组可能无法显示出来(例如,当排名=4变量F3=10时;这个小值完全被白色条形轮廓覆盖)。
您的样本数据:
DF1 <- structure(list(Rank = c(1L, 2L, 3L, 4L, 1L, 2L, 3L, 4L, 1L, 2L,
3L, 4L), variable = structure(c(1L, 1L, 1L, 1L, 2L, 2L, 2L, 2L,
3L, 3L, 3L, 3L), .Label = c("F1", "F2", "F3"), class = "factor"),
    value = c(500L, 400L, 300L, 200L, 250L, 100L, 155L, 90L,
    50L, 30L, 100L, 10L)), row.names = c(NA, -12L), .Names = c("Rank",
"variable", "value"), class = "data.frame")
geom_bar中,您可以添加其他参数,例如color和lwd。 - user3710546lwd解决。 - Soheil