我想使用ggplot2::geom_bar绘制堆叠柱状图,并根据一个分类变量设置背景阴影(使用ggplot2::geom_rect()),方法如下:
shading <- data.frame(min = seq(from = 0.5, to = max(as.numeric(as.factor(diamonds$clarity))), by = 1),
                      max = seq(from = 1.5, to = max(as.numeric(as.factor(diamonds$clarity))) + 0.5, by = 1),
                      col = c(0,1))

ggplot() +
  theme(panel.background = element_rect(fill = "transparent")) +
  geom_bar(data = diamonds, mapping = aes(clarity, fill=cut)) +
  geom_rect(data = shading,
            aes(xmin = min, xmax = max, ymin = -Inf, ymax = Inf,
                fill = factor(col), alpha = 0.1)) +
  geom_bar(data = diamonds, mapping = aes(clarity, fill=cut)) +
  guides(alpha = FALSE)
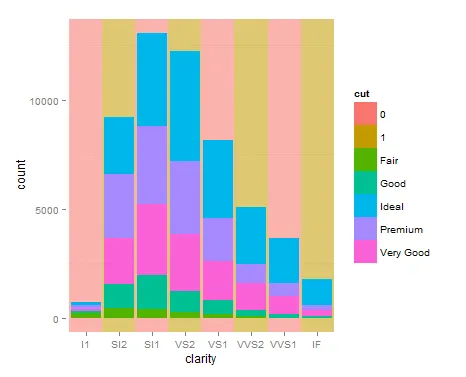
如何更改阴影颜色?我尝试了 scale_fill_manual(values = c("white", "gray53")),但似乎ggplot2中不允许多个比例美学 (https://github.com/hadley/ggplot2/issues/578)。是否有其他方法可以获得所需的结果?