我正在使用matplotlib.plot绘制一个有6个坐标轴的图形,每个坐标轴都有来自2个Pandas数据框中的3条线系列(每列1条线)。
import pandas as pd
import matplotlib.pyplot as plt

idx = pd.DatetimeIndex(start = '2013-01-01 00:00', periods =24,freq = 'H')
df1 = pd.DataFrame(index = idx, columns = ['line1','line2','line3'])
df1['line1']=  df1.index.hour
df1['line2'] = 24 - df1['line1']
df1['line3'] = df1['line1'].mean()
df2 = df1*2
df3= df1/2
df4= df2+df3

fig, ax = plt.subplots(2,2,squeeze=False,figsize = (10,10))
ax[0,0].plot(df1.index, df1,  marker='', linewidth=1, alpha=1)
ax[0,1].plot(df2.index, df2, marker='', linewidth=1, alpha=1)
ax[1,0].plot(df3.index, df3, marker='', linewidth=1, alpha=1)
ax[1,1].plot(df4.index, df4, marker='', linewidth=1, alpha=1)
fig.show()
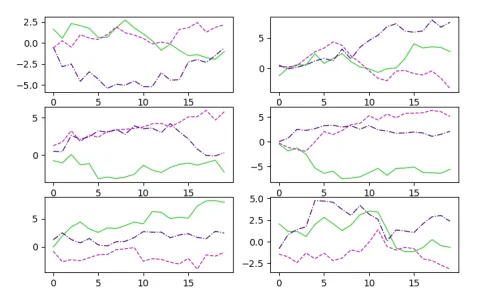
一切都很好,matplotlib会自动为每条线循环使用不同的颜色,但对于每个图形,使用相同的颜色,这正是我想要的。
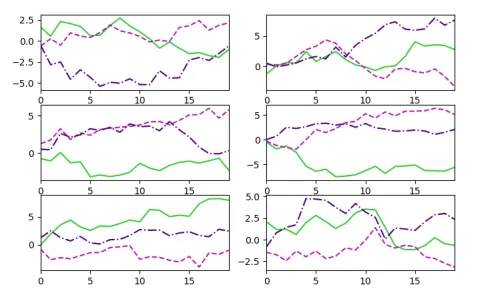
然而,现在我想为每条线指定更多细节:选择每条线的特定颜色和/或更改每条线的线型。
此链接显示了如何将多个线型传递给Pandas绘图。例如,使用:
ax = df.plot(kind='line', style=['-', '--', '-.'])
所以我需要做到以下两种方法之一:
- 将样式列表传递给我的上面的subplot命令,但是“style”未被识别,并且它不接受“linestyle”或“color”的列表。有什么办法可以做到这一点吗?
或者 使用
df.plot:fig, ax = plt.subplots(2,2,squeeze=False,figsize = (10,10)) ax[0,0] = df1.plot(style=['-','--','-.'], marker='', linewidth=1, alpha=1) ax[0,1] = df2.plot(style=['-','--','-.'],marker='', linewidth=1, alpha=1) ax[1,0] = df3.plot( style=['-','--','-.'],marker='', linewidth=1, alpha=1) ax[1,1] = df4.plot(style=['-','--','-.'], marker='', linewidth=1, alpha=1) fig.show()
我该如何使其中任何一种方法起作用?