在子图之间绘制分隔符或线条

17

我在一个图中绘制了四个子图,并使它们共享x轴。

然而,这些子图之间没有分隔符。我想在它们之间画一条线,或者是否有任何分隔符可以在这些子图中采用?

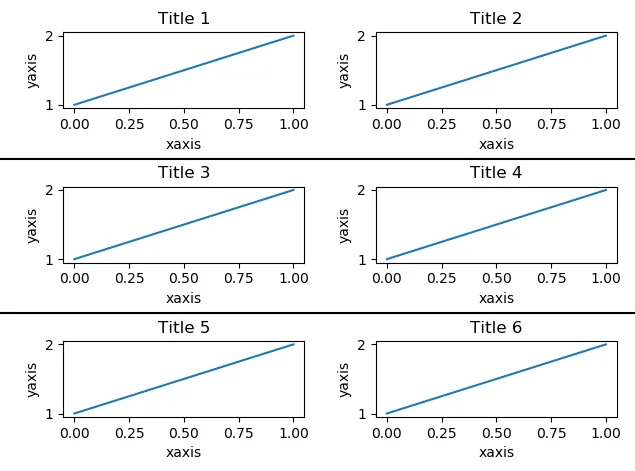
至少应该在子图的坐标轴之间有分隔符。我认为它应该如下图所示:

\------------------------------------

  subplot1

\------------------------------------

  subplot2

\------------------------------------

  ...

\------------------------------------

2个回答

21

如果轴/子图具有x标签或刻度标签等装饰,则不容易找到应分隔子图的正确位置,以使它们不会与文本重叠。

解决此问题的一种方法是获取包括装饰在内的轴的范围并在上下范围底部之间取平均值。

import numpy as np
import matplotlib.pyplot as plt
import matplotlib.transforms as mtrans

fig, axes = plt.subplots(3,2, squeeze=False)

for i, ax in enumerate(axes.flat):
    ax.plot([1,2])
    ax.set_title('Title ' + str(i+1))
    ax.set_xlabel('xaxis')
    ax.set_ylabel('yaxis')

# rearange the axes for no overlap
fig.tight_layout()

# Get the bounding boxes of the axes including text decorations
r = fig.canvas.get_renderer()
get_bbox = lambda ax: ax.get_tightbbox(r).transformed(fig.transFigure.inverted())
bboxes = np.array(list(map(get_bbox, axes.flat)), mtrans.Bbox).reshape(axes.shape)

#Get the minimum and maximum extent, get the coordinate half-way between those
ymax = np.array(list(map(lambda b: b.y1, bboxes.flat))).reshape(axes.shape).max(axis=1)
ymin = np.array(list(map(lambda b: b.y0, bboxes.flat))).reshape(axes.shape).min(axis=1)
ys = np.c_[ymax[1:], ymin[:-1]].mean(axis=1)

# Draw a horizontal lines at those coordinates
for y in ys:
    line = plt.Line2D([0,1],[y,y], transform=fig.transFigure, color="black")
    fig.add_artist(line)


plt.show()

输入图像描述


1
这是一个非常棒的答案,可能为我节省了数小时的工作时间。 - Peter
我不知道是否可能,或者是否应该开一个新问题。但是有可能以不同的方式对不同子空间的背景进行着色吗?例如(为第1、2张图设置浅灰色背景颜色-为第3、4张图设置灰色背景颜色-为第5、6张图设置深灰色背景颜色)。 对于整个图形,我将使用 fig、ax=plt.subplots(figsize=(2,4), facecolor='grey', dpi=300) - Andrea Ciufo
我也想添加垂直线? - Louie Lee
我喜欢当你找到一个看起来很复杂的SO答案,将其粘贴到自己的代码中,然后它就能正常工作。感谢这个。 - jds

7

我找到了一个解决方案,虽然不是完美的,但对我有用。

将下面的代码应用于每个子图对象。

其中 [-1, 1.5] 是假定覆盖图中所有X轴区域的值。并不是全部相同。

axes.plot([-1, 1.5], [0, 0], color='black', lw=1, transform=axes.transAxes, clip_on=False)
axes.plot([-1, 1.5], [1, 1], color='black', lw=1, transform=axes.transAxes, clip_on=False)

我尝试了另一种方式,我认为这是最完美的方式。如下所示的代码。
    trans = blended_transform_factory(self.figure.transFigure, axes.transAxes)
    line = Line2D([0, 1], [0, 0], color='w', transform=trans)
    self.figure.lines.append(line)

在上述代码中,该行将从每个图形边缘的起点开始,并且当图形大小改变时,该行会发生变化。

@SaulloCastro 我已经尝试使用axes.hlines(),但它无法在轴框之外绘制线条。 - Readon Shaw

网页内容由stack overflow 提供, 点击上面的
可以查看英文原文,
原文链接