我用Pyplot在Python中创建了多个子图的绘图。我想画一条不在任何一个子图上的线。我知道如何在一个子图上画一条线,但是我不知道如何在子图之间的空白处画线。谢谢。
谢谢您提供的链接,但我不想在子图之间画垂直线。实际上,我想在其中一个子图上方画一条水平线以表示某个范围。有没有办法在图形顶部绘制任意线条?
谢谢您提供的链接,但我不想在子图之间画垂直线。实际上,我想在其中一个子图上方画一条水平线以表示某个范围。有没有办法在图形顶部绘制任意线条?
首先,一个快速的方法是使用axvspan,其中y坐标大于1且clip_on=False。它绘制的是一个矩形而不是一条线。
以下是一个简单的示例:
import matplotlib.pyplot as plt

fig, ax = plt.subplots()
ax.plot(range(10))
ax.axvspan(2, 4, 1.05, 1.1, clip_on=False)
plt.show()
绘制线条时,只需将您想要使用的 transform 作为 plot 的关键字参数指定即可 (实际上,大多数其他绘图命令也是如此)。
要在“轴”坐标系中绘制 (例如,0,0 是轴的左下角,1,1 是右上角),请使用 transform=ax.transAxes,要在整个图中的坐标系中绘制 (例如,0,0 是图形窗口的左下角,而 1,1 是右上角),请使用 transform=fig.transFigure 。
正如@tcaswell所提到的, annotate 使得放置文本变得更加简单,并且可以非常有用地添加注释、箭头、标签等。您可以使用 annotate 来绘制一条在某个点和一个空字符串之间的线,但如果您只想绘制一条直线,则不需要这么做。
不过,对于您想要做的事情,您可能需要以稍微不同的方式处理。很容易创建一个转换,在其中 x 坐标使用一个转换,y 坐标使用另一个转换。这就是axhspan 和 axvspan 在幕后执行的操作。这对于您希望 y 坐标固定在轴坐标中,而 x 坐标反映数据坐标中特定位置的情况非常方便。
下面的示例说明了仅在轴坐标系中绘制和使用“混合”转换之间的差异。尝试在两个子图中滚动/缩放,注意发生了什么。
import matplotlib.pyplot as plt
from matplotlib.transforms import blended_transform_factory

fig, (ax1, ax2) = plt.subplots(nrows=2)

# Plot a line starting at 30% of the width of the axes and ending at
# 70% of the width, placed 10% above the top of the axes.
ax1.plot([0.3, 0.7], [1.1, 1.1], transform=ax1.transAxes, clip_on=False)

# Now, we'll plot a line where the x-coordinates are in "data" coords and the
# y-coordinates are in "axes" coords.
# Try panning/zooming this plot and compare to what happens to the first plot.
trans = blended_transform_factory(ax2.transData, ax2.transAxes)
ax2.plot([0.3, 0.7], [1.1, 1.1], transform=trans, clip_on=False)

# Reset the limits of the second plot for easier comparison
ax2.axis([0, 1, 0, 1])

plt.show()
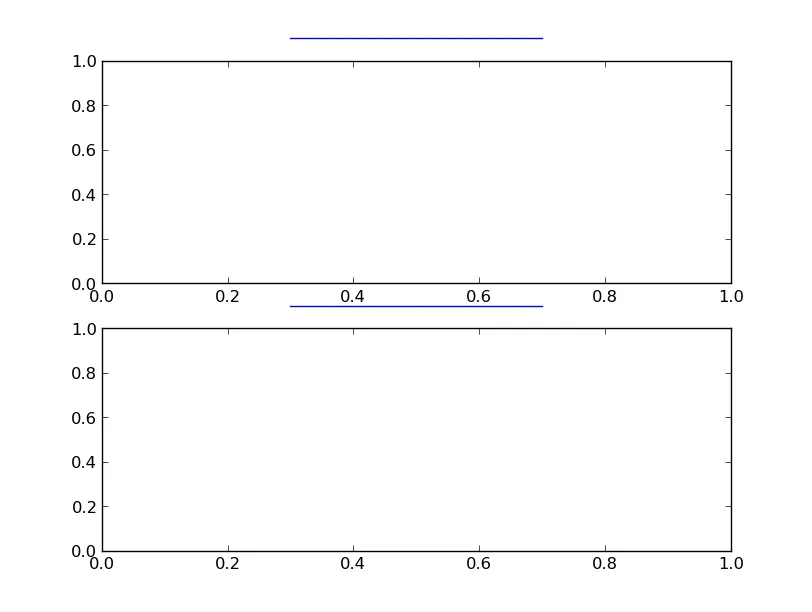
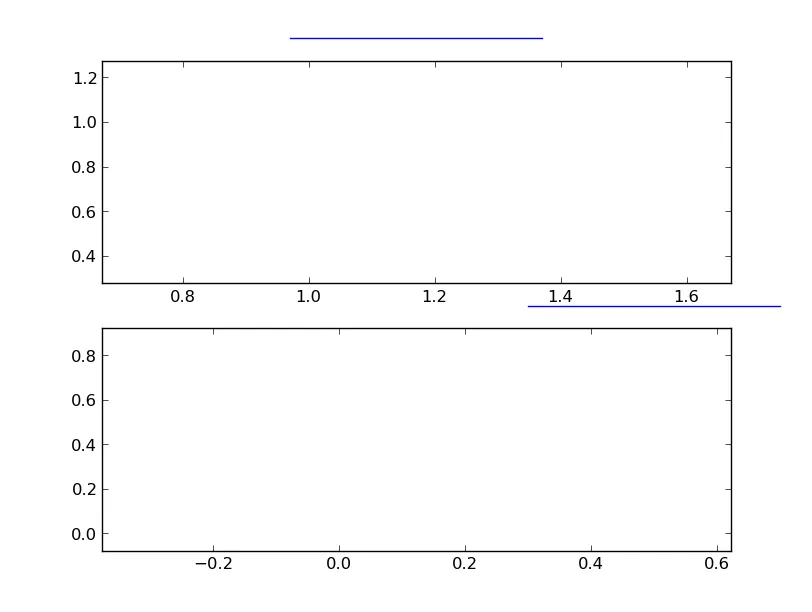
请注意,底部图表(使用“混合”变换)中的线条是数据坐标,并随新轴范围移动,而顶部线条是轴坐标并保持不变。
ax.hlines(1.1, 0.3, 0.7, clip_on=False, transform=ax.transAxes) 也是可行的,尽管这本质上与使用 plot 方法是相同的。至少我认为,在有意绘制水平线时,使用这种方法比使用 plot 更直观。 - sodd
clip_on=False可能会有所帮助。 - DSM