import pandas as pd
import matplotlib.pyplot as plt
import numpy as np
df1 = pd.DataFrame(np.random.randint(0,15,size=(15, 1)))
df2 = pd.DataFrame(np.random.randint(20,35,size=(10, 1)))
frames = [df1, df2]
result = pd.DataFrame(pd.concat(frames))
df3 = result.cumsum()
df3 = df3.reset_index(drop=False)
print(df3)
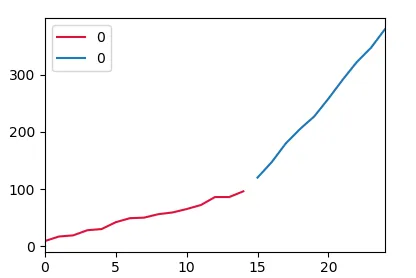
df3.plot(y=0)
plt.show()
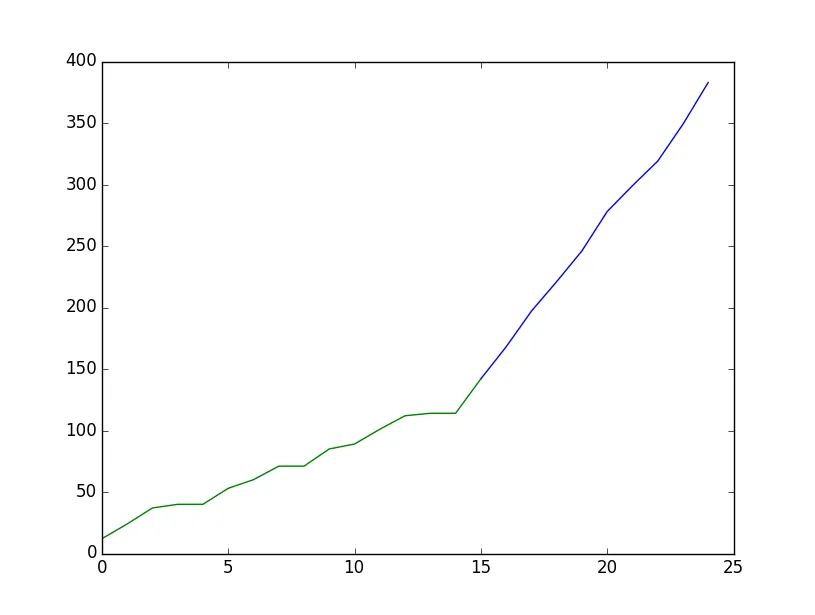
是否可以用两种不同的颜色绘制df3线?第一种颜色用于行0到14,第二种颜色用于行15到24。我想标记df1结束和df2开始的位置。