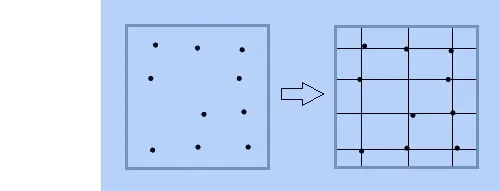
平行斜率普通最小二乘(OLS)模型:
y = mx + grp + b,其中m=斜率,b=y截距,grp=分类变量。
这是一种可以处理旋转网格的替代算法。
OLS模型包括原始方向上的数据点和同一数据点的90°旋转。这是必要的,以使所有网格线都平行且具有相同的斜率。
算法:
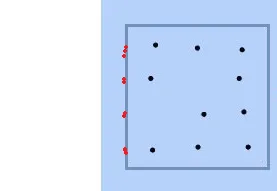
- 选择第一行或最后一行中斜率最接近零的两个相邻点作为参考网格线,用于与其余点进行比较。
- 计算此参考线与其余点之间的距离。
- 根据计算出的距离将点分成组(每个网格线一个组)。
- 针对90度旋转的网格重复步骤1至3,并合并结果。
- 创建平行斜率OLS模型,以确定网格线的线性方程。
- 将旋转后的网格线旋转回其原始方向。
- 计算交点。
注意:如果噪声、角度和/或缺失数据过多,则会失败。
示例:
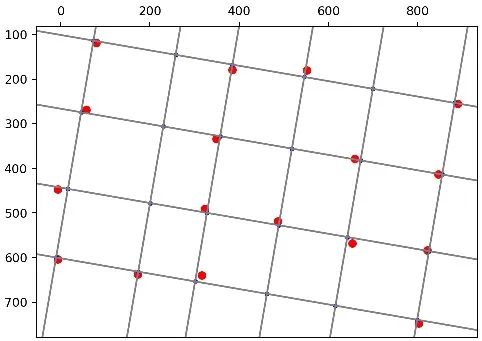
Python代码创建示例
def create_random_example():
first_row, last_row = 100, 900
first_col, last_col = 100, 600
num_rows = 6
num_cols = 4
rotation = 3
sd = 3
pct_remove = 30
x = np.linspace(first_col, last_col, num_cols)
y = np.linspace(first_row, last_row, num_rows)
xx, yy = np.meshgrid(x, y)
x = xx.flatten() + sd * np.mean(xx) * np.random.randn(xx.size) / 100
y = yy.flatten() + sd * np.mean(yy) * np.random.randn(yy.size) / 100
random_list = random.sample(range(0, num_cols*num_rows),
int(pct_remove*num_cols*num_rows/100))
x, y = np.delete(x, random_list), np.delete(y, random_list)
pts = np.column_stack((x, y))
radians = np.radians(rotation)
rot_mat = np.array([[np.cos(radians),-np.sin(radians)],
[np.sin(radians), np.cos(radians)]])
einsum = np.einsum('ji, mni -> jmn', rot_mat, [pts])
pts = np.squeeze(einsum).T
return np.rint(pts)
Python代码用于配合网格线
import numpy as np
import pandas as pd
import itertools
import math
import random
from statsmodels.formula.api import ols
from scipy.spatial import KDTree
import matplotlib.pyplot as plt
def pt_line_dist(pt, ref_line):
pt1, pt2 = [ref_line[:2], ref_line[2:]]
return np.linalg.norm(np.cross(pt1 - pt2, [pt[0],pt[1]])) \
/ np.linalg.norm(pt1 - pt2)
def segment_pts(amts, grp_var, grp_label):
amts = amts[amts[:, -1].argsort()]
first_amt_in_grp = amts[0][-1]
group, groups, grp = [], [], 0
for amt in amts:
if amt[-1] - first_amt_in_grp > grp_var:
groups.append(group)
first_amt_in_grp = amt[-1]
group = []; grp += 1
group.append(np.append(amt[:-1],[[grp_label + str(grp)]]))
groups.append(group)
return groups
def find_reference_line(pts):
y = np.hsplit(pts, 2)[1]
m = []
for i, y_pt in enumerate([ pts[np.argmin(y)], pts[np.argmax(y)] ]):
m.append(np.zeros((pts.shape[0]-1, 5)))
m[i][:,2:4] = np.delete(pts, np.where((pts==y_pt).all(axis=1))[0], axis=0)
m[i][:,4] = abs( (m[i][:,3]-y_pt[1]) / (m[i][:,2]-y_pt[0]) )
m[i][:,:2] = y_pt
m = np.vstack((m[0], m[1]))
return m[np.argmin(m[:,4]), :4]
np.seterr(divide='ignore')
pts = create_random_example()
plt.scatter(pts[:,0], pts[:,1], c='r')
tree = KDTree(pts)
nn_avg_dist = np.mean(tree.query(pts, 2)[0][:, 1])
groups = []
for orientation in ['o', 'r']:
if orientation == 'r':
pts[:,1] = -1 * pts[:,1]
pts[:, [1, 0]] = pts[:, [0, 1]]
ref_line = find_reference_line(pts)
pt_dists = np.zeros((pts.shape[0], 3))
pt_dists[:,:2] = pts
pt_dists[:,2] = np.apply_along_axis(pt_line_dist, 1, pts, ref_line).T
groups += segment_pts(pt_dists, 0.7*nn_avg_dist, orientation)
df = pd.DataFrame(np.row_stack(groups), columns=['x', 'y', 'grp'])
df['x'] = pd.to_numeric(df['x'])
df['y'] = pd.to_numeric(df['y'])
ols_model = ols("y ~ x + grp + 0", data=df).fit()
grid_lines = ols_model.params[:-1].to_frame()
grid_lines = grid_lines.rename(columns = {0:'b'})
grid_lines['grp'] = grid_lines.index.str[4:6]
grid_lines['m'] = ols_model.params[-1]
grid_lines.loc[grid_lines['grp'].str[0] == 'r', 'b'] = grid_lines['b'] / grid_lines['m']
grid_lines.loc[grid_lines['grp'].str[0] == 'r', 'm'] = -1 / grid_lines['m']
comb = list(itertools.combinations(grid_lines['grp'], 2))
comb = [i for i in comb if i[0][0] != 'r']
comb = [i for i in comb if i[1][0] != 'o']
df_comb = pd.DataFrame(comb, columns=['grp', 'r_grp'])
grid_pts = df_comb.merge(grid_lines.drop_duplicates('grp'),how='left',on='grp')
grid_lines.rename(columns={'grp': 'r_grp'}, inplace=True)
grid_pts.rename(columns={'b':'o_b', 'm': 'o_m', 'grp':'o_grp'}, inplace=True)
grid_pts = grid_pts.merge(grid_lines.drop_duplicates('r_grp'),how='left',on='r_grp')
grid_pts.rename(columns={'b':'r_b', 'm': 'r_m'}, inplace=True)
grid_pts['x'] = (grid_pts['r_b']-grid_pts['o_b']) \
/ (grid_pts['o_m']-grid_pts['r_m'])
grid_pts['y'] = grid_pts['o_m'] * grid_pts['x'] + grid_pts['o_b']
print(grid_lines)
print(grid_pts)
plt.scatter(grid_pts['x'], grid_pts['y'], s=8, c='b')
axes = plt.gca()
axes.invert_yaxis()
axes.xaxis.tick_top()
axes.set_aspect('equal')
axes.set_xlim(axes.get_xlim())
axes.set_ylim(axes.get_ylim())
x_vals = np.array(axes.get_xlim())
for idx in grid_lines.index:
y_vals = grid_lines['b'][idx] + grid_lines['m'][idx] * x_vals
plt.plot(x_vals, y_vals, c='gray')
plt.show()
xs, ys = map(list, zip(*xys))在numpy中可以很容易地写成xs, ys = xys[:,0], xys[:, 1]。也许你可以自己试试看? - undefined