如何使用Matplotlib/Seaborn绘制并排的两个堆叠直方图

3
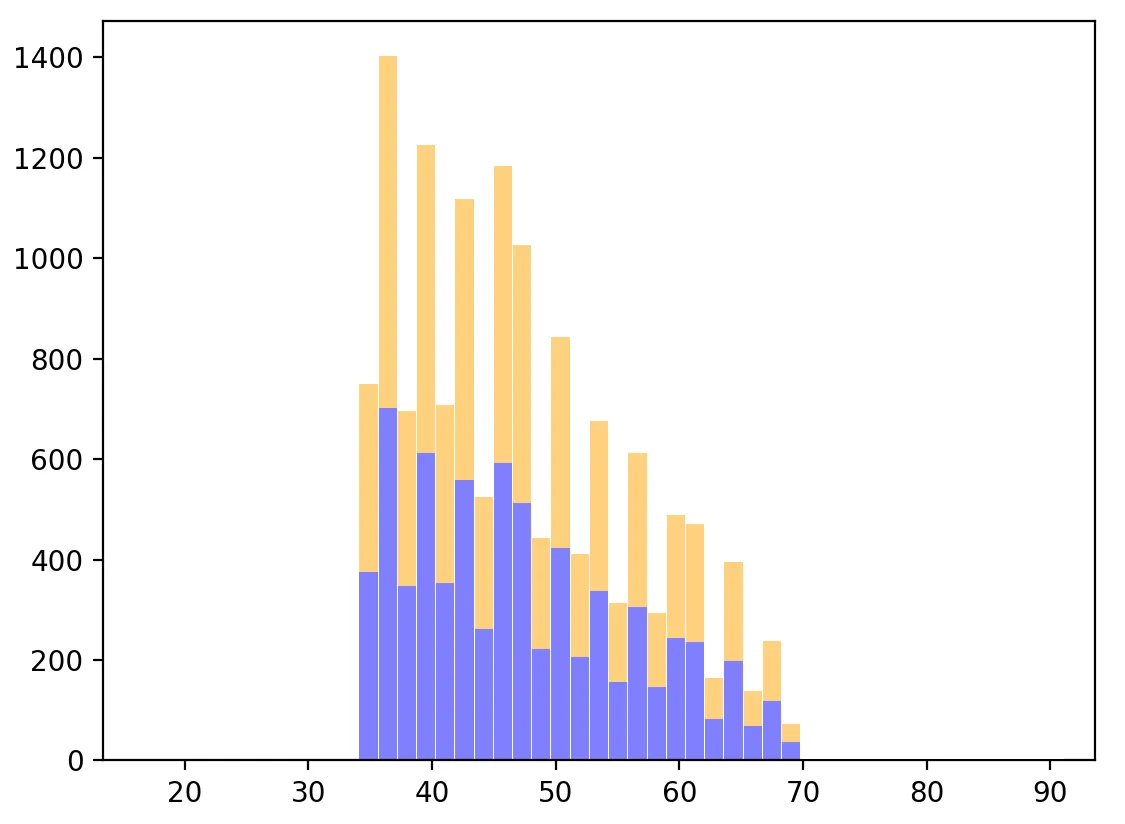
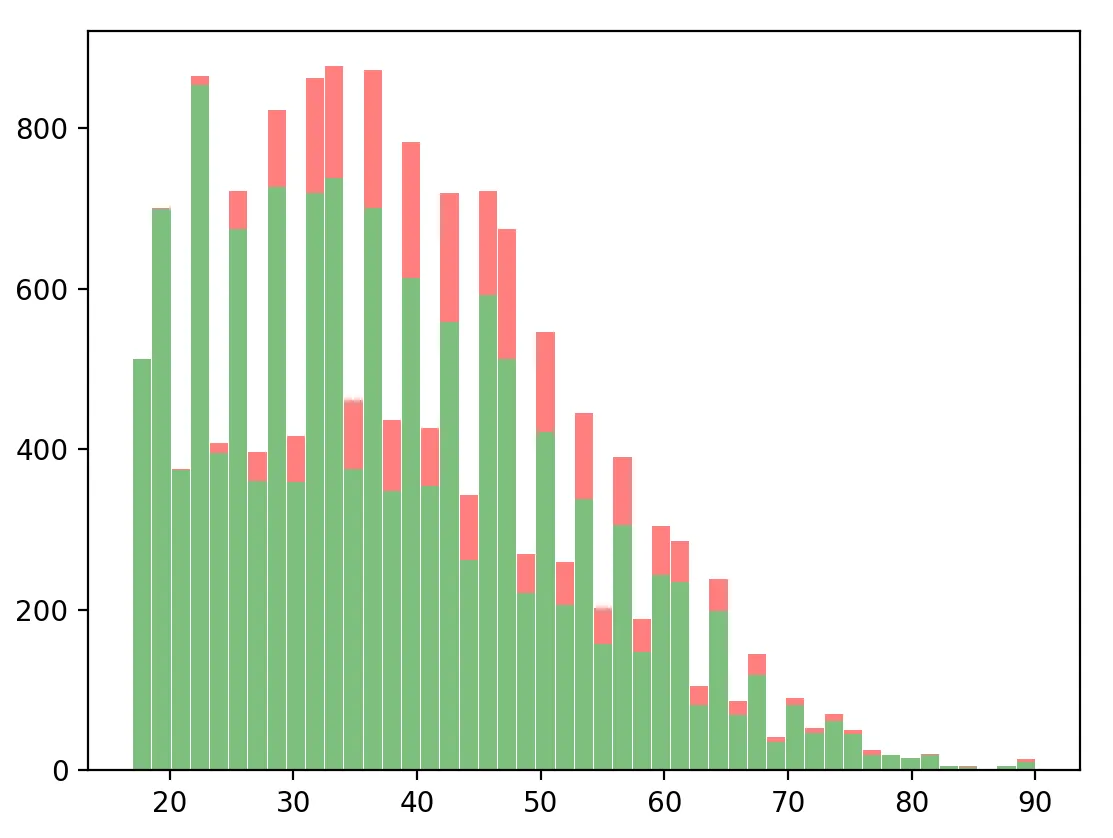
我正在使用以下代码绘制一对堆叠的直方图。 我在两者上都使用相同的箱边缘,以便它们可以很好地对齐。
如何将它们显示在同一张图表上?即每个箱子有绿色/红色和蓝色/橙色两个条形图并列显示。
我看到许多类似于这个的问题和答案,建议使用条形图,并计算条形图的宽度,但这似乎应该是matplotlib开箱即用支持的功能。
此外,我能否直接使用seaborn绘制堆叠直方图?我找不到方法。
plt.hist( [correct_a, incorrect_a], bins=edges, stacked=True, color=['green', 'red'], rwidth=0.95, alpha=0.5)

enter image description here

plt.hist( [correct_b, incorrect_b], bins=edges, stacked=True, color=['green', 'red'], rwidth=0.95, alpha=0.5)

enter image description here

2个回答

2

我认为在这里你最好使用plt.bar。要创建堆叠的直方图,可以使用它的bottom参数。要并排显示两个条形图,可以通过将x值移动一些width来实现,就像这个原始的matplotlib示例中所示:

import numpy as np
import matplotlib.pyplot as plt

fig, ax = plt.subplots(figsize=(16, 8))

correct_a = np.random.randint(0, 20, 20)
incorrect_a = np.random.randint(0, 20, 20)
correct_b = np.random.randint(0, 20, 20)
incorrect_b = np.random.randint(0, 20, 20)
edges = len(correct_a)
width=0.35

rects1 = ax.bar(np.arange(edges), incorrect_a, width, color="red", label="incorrect_a")
rects2 = ax.bar(np.arange(edges), correct_a, width, bottom=incorrect_a, color='seagreen', label="correct_a")
rects3 = ax.bar(np.arange(edges) + width, incorrect_b, width, color="blue", label="incorrect_b")
rects4 = ax.bar(np.arange(edges) + width, correct_b, width, bottom=incorrect_b, color='orange', label="correct_b")

# placing the ticks to the middle
ticks_aligned = np.arange(edges) + width // 2
ax.set_xticks(np.arange(edges) + width / 2)
ax.set_xticklabels((str(tick) for tick in ticks_aligned))
ax.legend()

这将返回:

1


0
这是一个简单的示例(直方图未堆叠),用于同时显示2个直方图,每个条形桶都有专门的位置,它们并排放置。
# generating some data for this example:
a = [1,2,3,4,3,4,2,3,4,5,4,3,4,5,4,1,2,3,2,1,3,4,5,6,7,6,5,4,3,4,6,5,4,3,4]
b = [1,2,3,4,5,6,7,6,5,6,7,6,5,4,3,4,5,6,7,6,7,6,7,5,4,3,2,1,3,4,5,6,5,6,5,6,7,6,7]

# plotting 2 histograms with bars centered differently within each bin:
plt.hist(a, bins=5, align='left', rwidth=0.5)
plt.hist(b, bins=5, align='mid', rwidth=0.5, color='r')

网页内容由stack overflow 提供, 点击上面的
可以查看英文原文,
原文链接