使用matplotlib并排绘制图像

117

我想知道如何使用matplotlib将图像并排排列,例如像这样:

enter image description here

我最接近的结果是这个:

enter image description here

这个效果是通过使用以下代码产生的:

f, axarr = plt.subplots(2,2)
axarr[0,0] = plt.imshow(image_datas[0])
axarr[0,1] = plt.imshow(image_datas[1])
axarr[1,0] = plt.imshow(image_datas[2])
axarr[1,1] = plt.imshow(image_datas[3])
但我似乎无法显示其他图像。我认为必须有更好的方法来做这件事,因为我想管理索引可能很麻烦。我已经查看了文档,但我觉得可能看错了。是否有人能够向我提供一个示例或指点一下方向?

编辑:

如果您想要一个函数来自动确定网格大小,请参见答案来自@duhaime


也许这会有帮助:Python、Matplotlib、绘制不规则网格 - Lucas
请查看演示使用plt.subplots()的示例 - Stop harming Monica
作为一种参考,可以取消接受旧答案,转而采用更好的新答案。就个人而言,我认为你的答案,YellowPillow,是这个问题的更好解决方案。 - Trenton McKinney
哈哈,看起来原帖作者正在学习自动驾驶汽车工程课程。我也在学!似乎我们两个都遇到了同样的问题。 - stackoverflowuser2010
9个回答

172

你面临的问题是尝试将imshow的返回值(即一个matplotlib.image.AxesImage)分配给现有的轴对象。

axarr中绘制图像数据的正确方法是:

f, axarr = plt.subplots(2,2)
axarr[0,0].imshow(image_datas[0])
axarr[0,1].imshow(image_datas[1])
axarr[1,0].imshow(image_datas[2])
axarr[1,1].imshow(image_datas[3])

对于所有子图而言,概念是相同的,并且在大多数情况下,轴实例提供与pyplot(plt)接口相同的方法。例如,如果ax是您的子图轴之一,则绘制普通线图时,您将使用ax.plot(..)而不是plt.plot()。您实际上可以在您链接到的页面的源代码中找到这个信息。


68

我发现一个非常有用的方法,可以打印出所有的图片:

_, axs = plt.subplots(n_row, n_col, figsize=(12, 12))
axs = axs.flatten()
for img, ax in zip(imgs, axs):
    ax.imshow(img)
plt.show()

32
你正在将所有的图片都绘制在同一个坐标轴上。你想要的是为每个坐标轴单独获取一个句柄,然后在那里绘制你的图片。就像这样:

您正在将所有图像绘制在一个坐标轴上。您想要的是分别获取每个坐标轴的句柄,并在其上绘制您的图像。就像这样:

fig = plt.figure()
ax1 = fig.add_subplot(2,2,1)
ax1.imshow(...)
ax2 = fig.add_subplot(2,2,2)
ax2.imshow(...)
ax3 = fig.add_subplot(2,2,3)
ax3.imshow(...)
ax4 = fig.add_subplot(2,2,4)
ax4.imshow(...)

想要了解更多信息,请查看这里:http://matplotlib.org/examples/pylab_examples/subplots_demo.html

对于复杂的布局,您应该考虑使用gridspec:http://matplotlib.org/users/gridspec.html


30

如果图像存储在一个数组中,你想要循环遍历每个元素并打印出来,可以按照以下代码编写:

plt.figure(figsize=(10,10)) # specifying the overall grid size

for i in range(25):
    plt.subplot(5,5,i+1)    # the number of images in the grid is 5*5 (25)
    plt.imshow(the_array[i])

plt.show()

请注意,我使用的是subplot而不是subplots。它们是不同的。


17

下面是一个完整的函数show_image_list(),它以网格形式并排显示图像。您可以使用不同的参数调用该函数。

  1. 传入一个
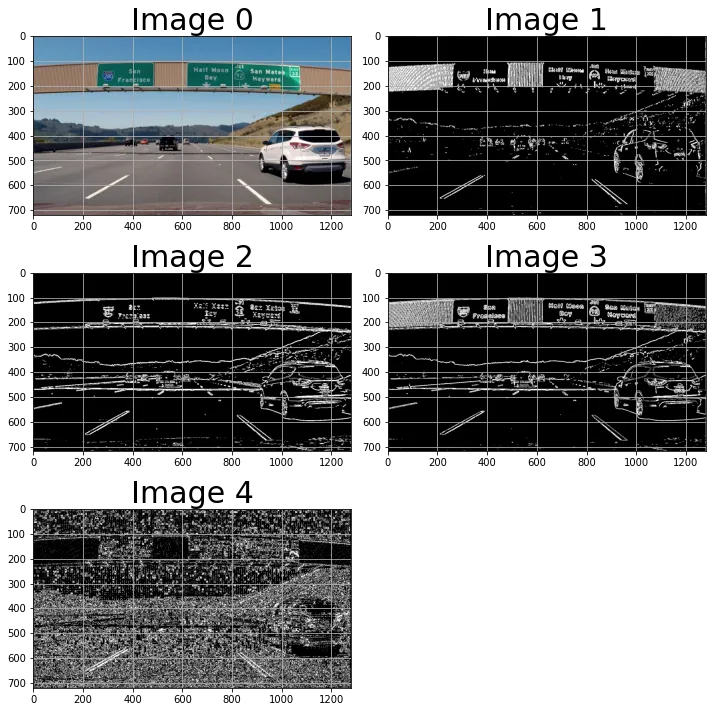
list类型的图像,其中每个图像都是Numpy数组。默认情况下,它将创建具有2列的网格。它还会推断出每个图像是彩色还是灰度。
list_images = [img, gradx, grady, mag_binary, dir_binary]

show_image_list(list_images, figsize=(10, 10))

输入图像描述

  1. 传入一组图像的list,每个图像对应一个标题的list,以及其他参数。
show_image_list(list_images=[img, gradx, grady, mag_binary, dir_binary], 
                list_titles=['original', 'gradx', 'grady', 'mag_binary', 'dir_binary'],
                num_cols=3,
                figsize=(20, 10),
                grid=False,
                title_fontsize=20)

输入图像描述

这是代码:

import matplotlib.pyplot as plt
import numpy as np

def img_is_color(img):

    if len(img.shape) == 3:
        # Check the color channels to see if they're all the same.
        c1, c2, c3 = img[:, : , 0], img[:, :, 1], img[:, :, 2]
        if (c1 == c2).all() and (c2 == c3).all():
            return True

    return False

def show_image_list(list_images, list_titles=None, list_cmaps=None, grid=True, num_cols=2, figsize=(20, 10), title_fontsize=30):
    '''
    Shows a grid of images, where each image is a Numpy array. The images can be either
    RGB or grayscale.

    Parameters:
    ----------
    images: list
        List of the images to be displayed.
    list_titles: list or None
        Optional list of titles to be shown for each image.
    list_cmaps: list or None
        Optional list of cmap values for each image. If None, then cmap will be
        automatically inferred.
    grid: boolean
        If True, show a grid over each image
    num_cols: int
        Number of columns to show.
    figsize: tuple of width, height
        Value to be passed to pyplot.figure()
    title_fontsize: int
        Value to be passed to set_title().
    '''

    assert isinstance(list_images, list)
    assert len(list_images) > 0
    assert isinstance(list_images[0], np.ndarray)

    if list_titles is not None:
        assert isinstance(list_titles, list)
        assert len(list_images) == len(list_titles), '%d imgs != %d titles' % (len(list_images), len(list_titles))

    if list_cmaps is not None:
        assert isinstance(list_cmaps, list)
        assert len(list_images) == len(list_cmaps), '%d imgs != %d cmaps' % (len(list_images), len(list_cmaps))

    num_images  = len(list_images)
    num_cols    = min(num_images, num_cols)
    num_rows    = int(num_images / num_cols) + (1 if num_images % num_cols != 0 else 0)

    # Create a grid of subplots.
    fig, axes = plt.subplots(num_rows, num_cols, figsize=figsize)
    
    # Create list of axes for easy iteration.
    if isinstance(axes, np.ndarray):
        list_axes = list(axes.flat)
    else:
        list_axes = [axes]

    for i in range(num_images):

        img    = list_images[i]
        title  = list_titles[i] if list_titles is not None else 'Image %d' % (i)
        cmap   = list_cmaps[i] if list_cmaps is not None else (None if img_is_color(img) else 'gray')
        
        list_axes[i].imshow(img, cmap=cmap)
        list_axes[i].set_title(title, fontsize=title_fontsize) 
        list_axes[i].grid(grid)

    for i in range(num_images, len(list_axes)):
        list_axes[i].set_visible(False)

    fig.tight_layout()
    _ = plt.show()


9
根据 Matplotlib 对于图像网格的建议
import matplotlib.pyplot as plt
from mpl_toolkits.axes_grid1 import ImageGrid

fig = plt.figure(figsize=(4., 4.))
grid = ImageGrid(fig, 111,  # similar to subplot(111)
                 nrows_ncols=(2, 2),  # creates 2x2 grid of axes
                 axes_pad=0.1,  # pad between axes in inch.
                 )

for ax, im in zip(grid, image_data):
    # Iterating over the grid returns the Axes.
    ax.imshow(im)

plt.show()

5

我每周都会访问这个URL。对于那些想要一个不费力的功能,只需绘制图像网格的人,我们来试试:

import matplotlib.pyplot as plt
import numpy as np

def plot_image_grid(images, ncols=None, cmap='gray'):
    '''Plot a grid of images'''
    if not ncols:
        factors = [i for i in range(1, len(images)+1) if len(images) % i == 0]
        ncols = factors[len(factors) // 2] if len(factors) else len(images) // 4 + 1
    nrows = int(len(images) / ncols) + int(len(images) % ncols)
    imgs = [images[i] if len(images) > i else None for i in range(nrows * ncols)]
    f, axes = plt.subplots(nrows, ncols, figsize=(3*ncols, 2*nrows))
    axes = axes.flatten()[:len(imgs)]
    for img, ax in zip(imgs, axes.flatten()): 
        if np.any(img):
            if len(img.shape) > 2 and img.shape[2] == 1:
                img = img.squeeze()
            ax.imshow(img, cmap=cmap)

# make 16 images with 60 height, 80 width, 3 color channels
images = np.random.rand(16, 60, 80, 3)

# plot them
plot_image_grid(images)

1
这很好,但如果图像数量是质数,则效果不佳。如果图像数量不能被ncols整除,则还会产生大量额外的轴。创建imgs似乎没有任何有用的作用。 - Trenton McKinney
如果要绘制的图像数量没有因子,那么应该绘制什么并不清楚。可以轻松地删除这些额外的轴。imgs用于允许zip操作;删除额外的轴将起到相同的效果。 - duhaime
“imgs” 不是必需的。 “zip” 只会组合到最短长度的可迭代对象。当最短输入可迭代对象用尽时,迭代器停止。 - Trenton McKinney
啊,非常好!我只压缩了相等长度的可迭代对象。无论如何,编码愉快! - duhaime
这是一个非常有用的功能。但是需要使用plt.show()来显示图片。 - Nav

2

从数据集中随机选择一张图片并进行可视化的示例代码

def get_random_image(num):
    path=os.path.join("/content/gdrive/MyDrive/dataset/",images[num])
    image=cv2.imread(path)
    return image

调用该函数

images=os.listdir("/content/gdrive/MyDrive/dataset")
random_num=random.randint(0, len(images))
img=get_random_image(random_num)
plt.figure(figsize=(8,8))
plt.imshow(cv2.cvtColor(img,cv2.COLOR_BGR2RGB))

展示给定数据集中的随机图像集群。
#Making a figure containing 16 images 
lst=random.sample(range(0,len(images)), 16)
plt.figure(figsize=(12,12))
for index,value in  enumerate(lst):
    img=get_random_image(value)
    img_resized=cv2.resize(img,(400,400))
    #print(path)
    plt.subplot(4,4,index+1)
    plt.imshow(img_resized)
    plt.axis('off')

plt.tight_layout()
plt.subplots_adjust(wspace=0, hspace=0)
#plt.savefig(f"Images/{lst[0]}.png")
plt.show() 


-1

绘制数据集中的图像 这里rand给出一个随机索引值,用于选择数据集中的随机图像,labels具有每个图像类型的整数表示,labels_dict是一个包含键值信息的字典

fig,ax = plt.subplots(5,5,figsize = (15,15))
ax = ax.ravel()
for i in range(25):
  rand = np.random.randint(0,len(image_dataset))
  image = image_dataset[rand]
  ax[i].imshow(image,cmap = 'gray')
  ax[i].set_title(labels_dict[labels[rand]])
  
plt.show()

这本质上是其他答案的副本:123,只是加了一点点,让我展示一下如何做我没有询问的事情。 - Trenton McKinney

网页内容由stack overflow 提供, 点击上面的
可以查看英文原文,
原文链接