我有一些要为演示文稿绘制的点,但是,除了绘制出特定的球形点外,还有没有办法绘制PNG图像,就像这样:
plt.scatter(X,Y, img='figure.png')
我有一些要为演示文稿绘制的点,但是,除了绘制出特定的球形点外,还有没有办法绘制PNG图像,就像这样:
plt.scatter(X,Y, img='figure.png')
AnnotationBox 模块在 matplotlib 中有助于绘制可视化中的图像,而不是点。
import numpy as np
import matplotlib.pyplot as plt
from matplotlib.offsetbox import OffsetImage, AnnotationBbox
from matplotlib.cbook import get_sample_data

def main():
    x = np.linspace(0, 10, 20)
    y = np.cos(x)
    image_path = get_sample_data('pic.png')
    fig, ax = plt.subplots()
    imscatter(x, y, image_path, zoom=0.1, ax=ax)
    ax.plot(x, y)
    plt.show()

def imscatter(x, y, image, ax=None, zoom=1):
    if ax is None:
        ax = plt.gca()
    try:
        image = plt.imread(image)
    except TypeError:
        pass
    im = OffsetImage(image, zoom=zoom)
    x, y = np.atleast_1d(x, y)
    artists = []
    for x0, y0 in zip(x, y):
        ab = AnnotationBbox(im, (x0, y0), xycoords='data', frameon=False)
        artists.append(ax.add_artist(ab))
    ax.update_datalim(np.column_stack([x, y]))
    ax.autoscale()
    return artists

main()
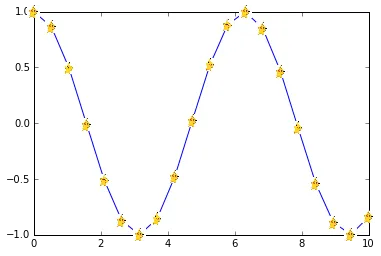
生成的图片: