我有保存圆心的NumPy数组。
import matplotlib.pylab as plt
import numpy as np
npX = np.asarray(X)
npY = np.asarray(Y)
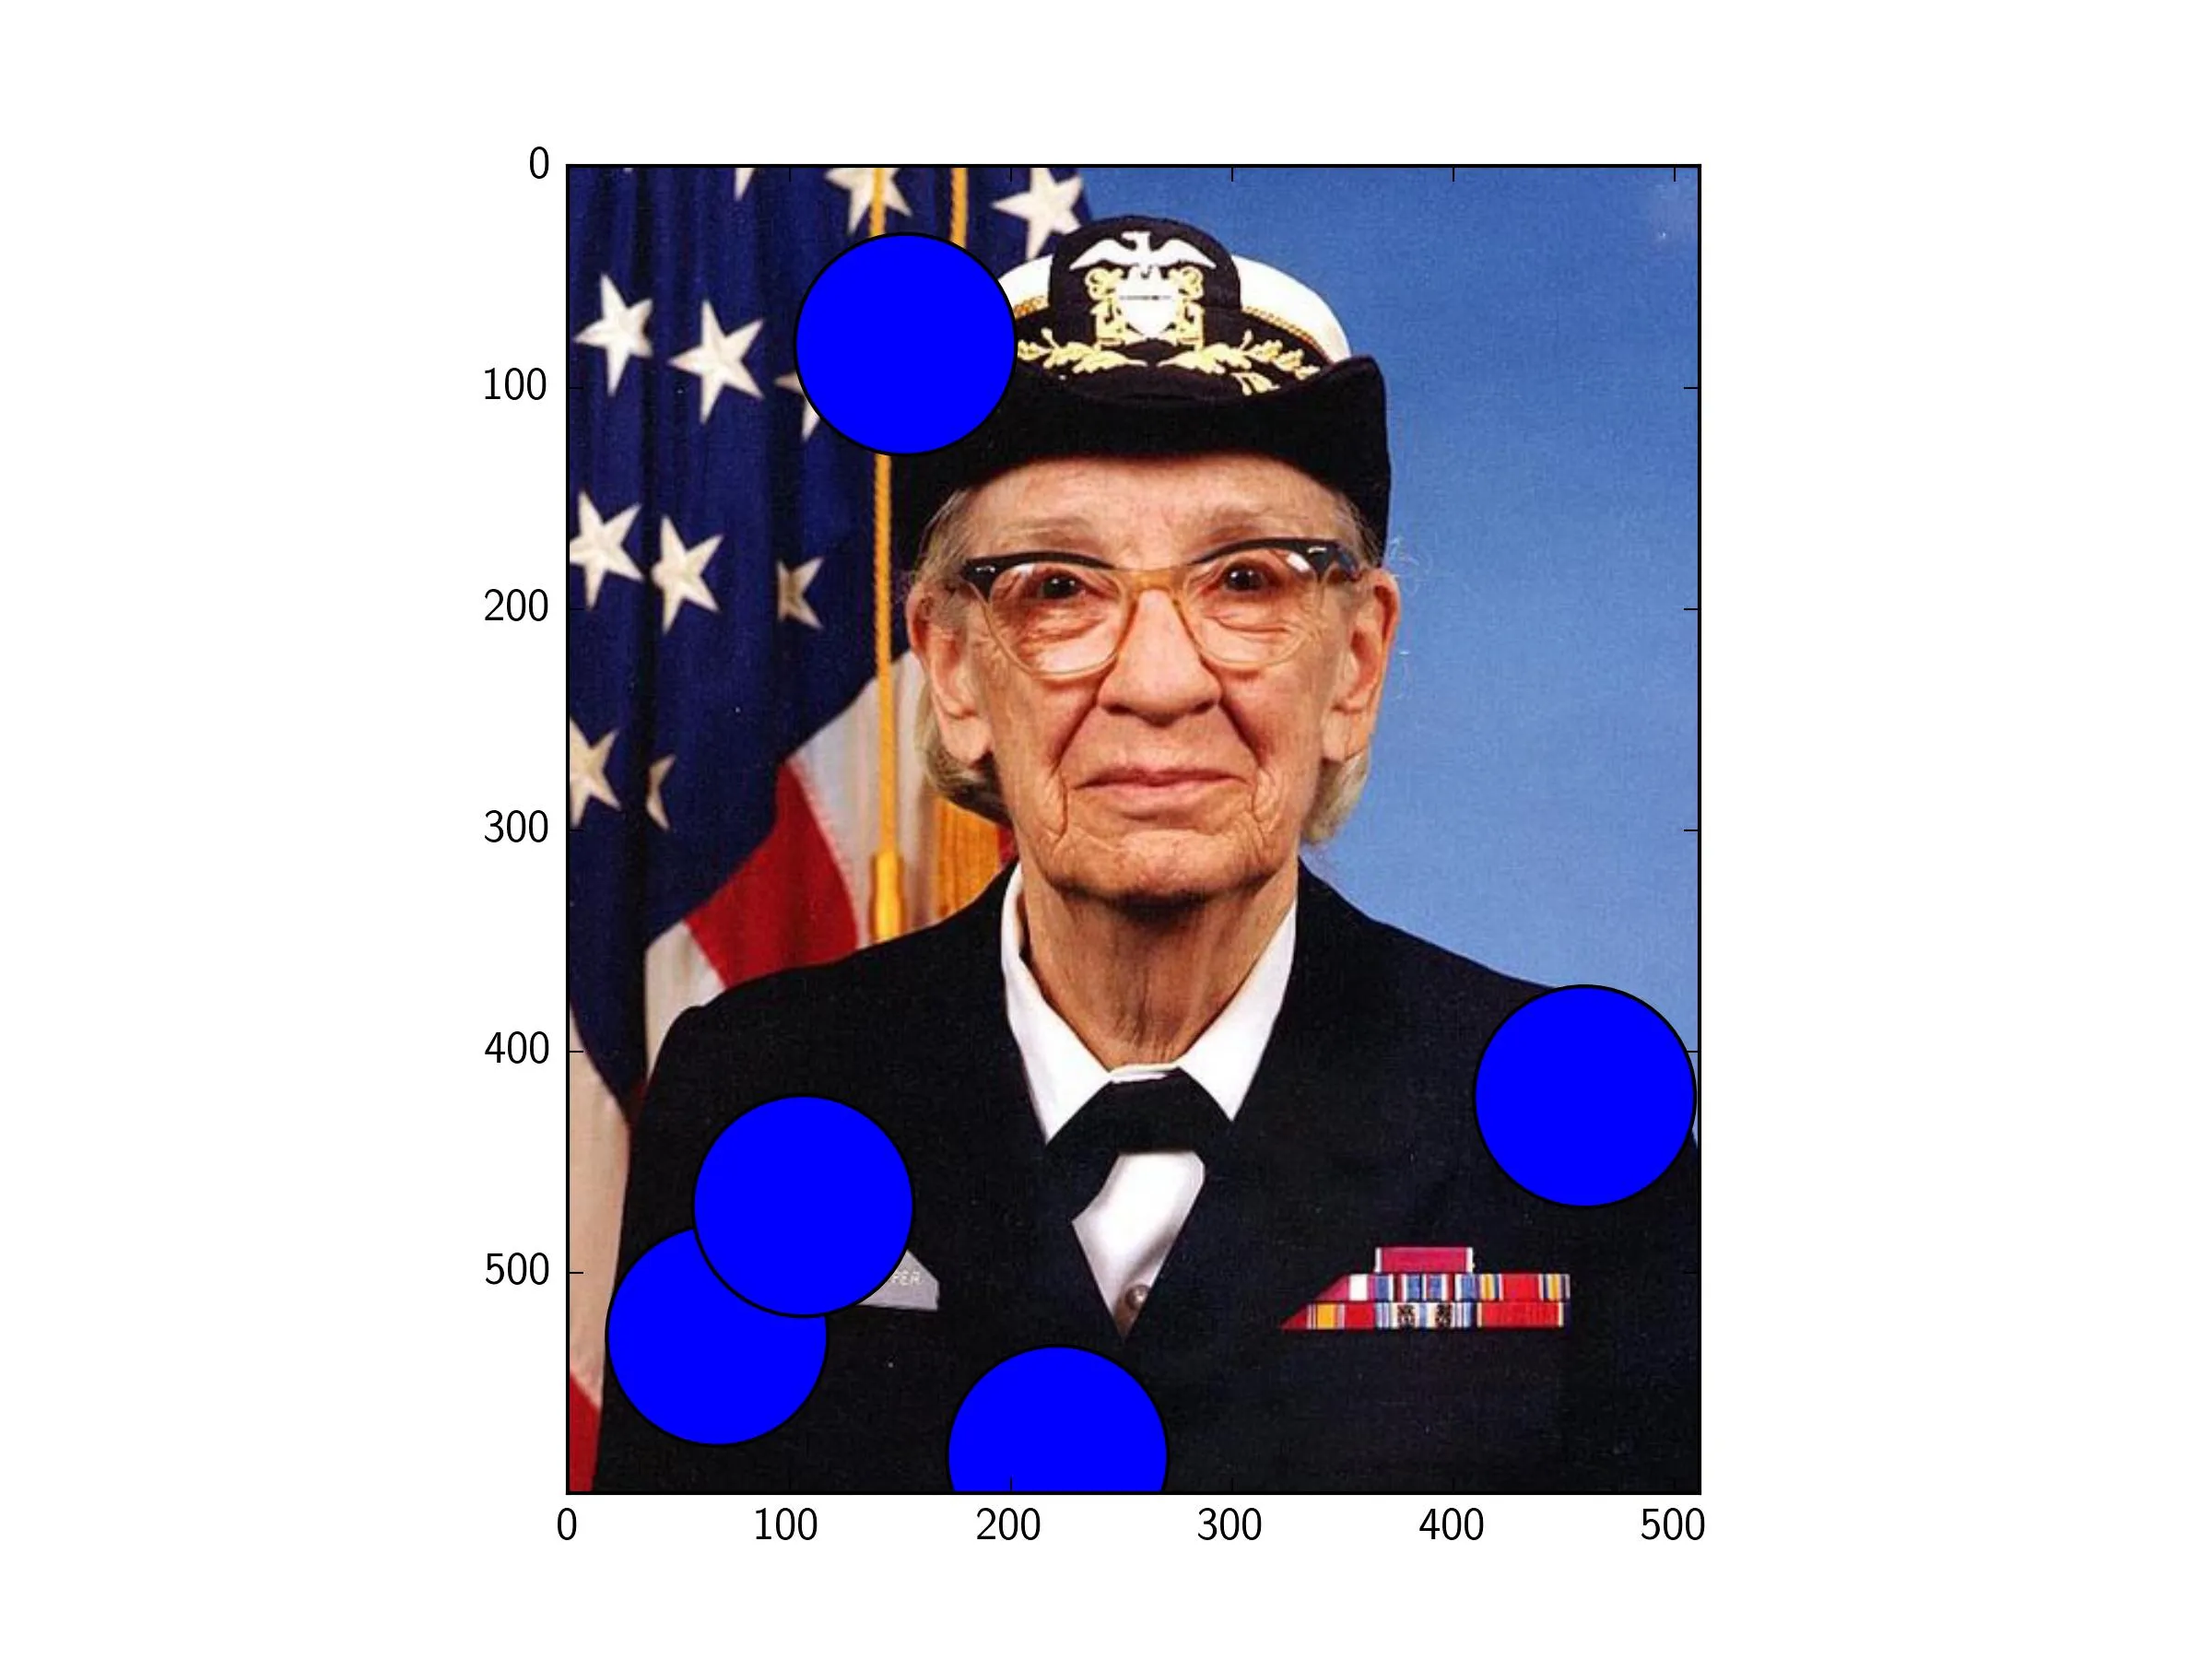
plt.imshow(img)
// TO-DO
plt.show()
我该如何在我的图片上显示给定位置的圆?
draw.polygon(...)更改为draw.ellipse(...)。有关详细信息,请参阅PIL文档:http://effbot.org/imagingbook/imagedraw.htm。 - Warren Weckesser