我想绘制一个形状为[高度x宽度x3]的numpy数组,其中包含RGB值。举个简单的例子,假设你有比利时国旗:
import numpy as np
import matplotlib.pyplot as plt

flag = np.empty((1,3,3))
flag[0,0,:] = (0,0,0)
flag[0,1,:] = (254,240,71)
flag[0,2,:] = (255,55,14)
plt.imshow(flag)
plt.show()
这将导致以下输出:
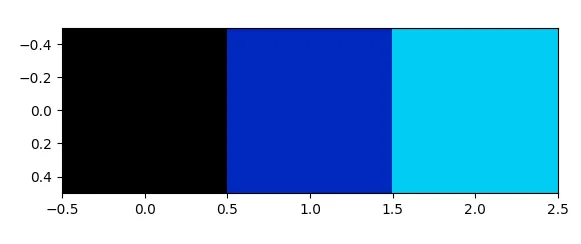 有谁能告诉我为什么它没有绘制正确的RGB值?我在维度上犯了错误吗?可能很容易回答这个问题,但似乎找不到答案..非常感谢任何建议!
imshow中使用整数值,请通过plt.imshow(flag.astype(np.uint8))将您的数组转换为无符号整数。 - ImportanceOfBeingErnest