我正在尝试绘制从一堆点(3D多面体)接收到的协方差矩阵的特征向量。以下是我的操作:
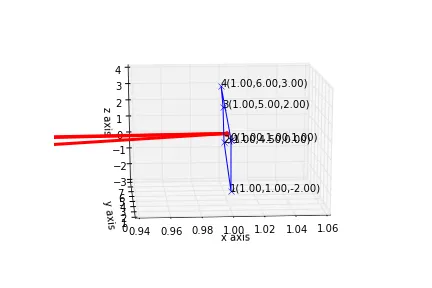
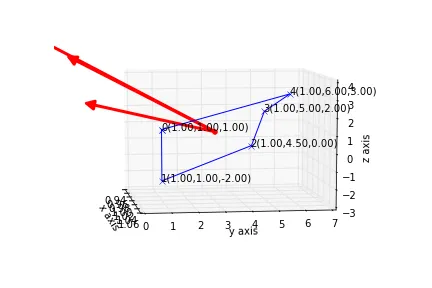
通过这种方法得到的图形不太令人满意。从两个不同的角度查看特征向量。
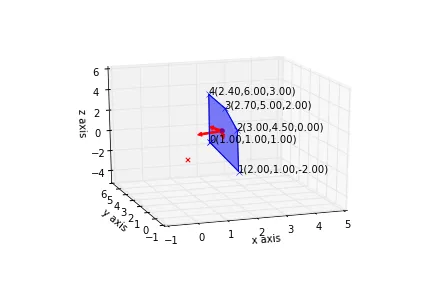
 我原本期望得到像这样的结果。向量从重心突出以给出最大方差的方向。但似乎并没有起作用,也许特征向量没有被
在进入绘图部分的
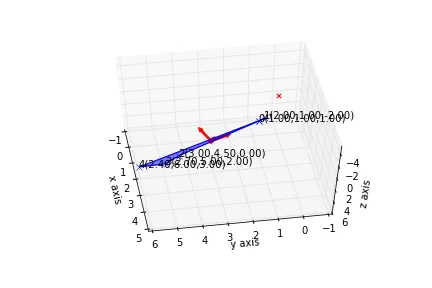
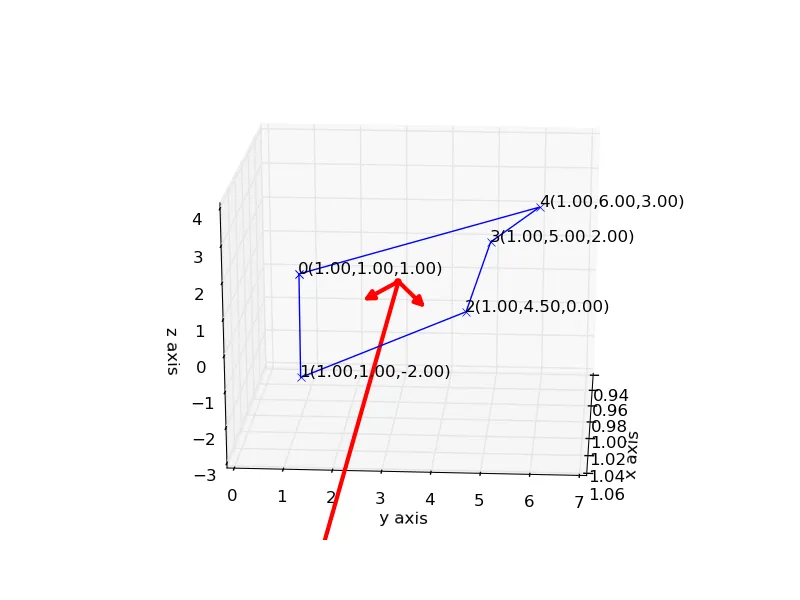
现在我得到了类似下面的东西:
import numpy as np
import matplotlib.pyplot as plt
from mpl_toolkits.mplot3d import Axes3D
from numpy import linalg as la
from matplotlib.patches import FancyArrowPatch
from mpl_toolkits.mplot3d import proj3d

class Arrow3D(FancyArrowPatch):
    def __init__(self, xs, ys, zs, *args, **kwargs):
        FancyArrowPatch.__init__(self, (0,0), (0,0), *args, **kwargs)
        self._verts3d = xs, ys, zs

    def draw(self, renderer):
        xs3d, ys3d, zs3d = self._verts3d
        xs, ys, zs = proj3d.proj_transform(xs3d, ys3d, zs3d, renderer.M)
        self.set_positions((xs[0],ys[0]),(xs[1],ys[1]))
        FancyArrowPatch.draw(self, renderer)
##################################################################################################
#here i start with drawing the actual polyhedron and the vector
##################################################################################################
#generate num random points in 3d
num = 5
#coord = 10*np.random.rand(3,num)#num points in 3D #first axis is x, second = y, third = z
#xcod = np.array([1,2,3,2.7,2.4,1])
xcod = np.array([1,1,1,1,1,1])
ycod = np.array([1,1,4.5,5.,6,1])
zcod = np.array([1,-2,0,2,3,1])
#coord = np.concatenate(coord,coord[0])
#####plotting in 3d
fig = plt.figure()
ax = fig.add_subplot(111,projection = '3d')
#plotting all the points
ax.plot(xcod,ycod,zcod,'x-')
#adding labels for vertice
for i in range(num):
    ax.text(xcod[i],ycod[i],zcod[i],'%d(%.2f,%.2f,%.2f)'%(i,xcod[i],ycod[i],zcod[i]))
#supposed centroid
centroid = np.array([np.mean(xcod),np.mean(ycod),np.mean(zcod)])
ax.scatter(centroid[0],centroid[1],centroid[2],marker = 'o',color='r')
#labelling the axes
ax.set_xlabel("x axis")
ax.set_ylabel("y axis")
ax.set_zlabel("z axis")
#getting a stack of all vertices, while removing last repeat vertex
cod = np.vstack((np.delete(xcod,-1),np.delete(ycod,-1),np.delete(zcod,-1)))
#caculating covariance matrix
#ddof = 0 is using simple averages or normalising with N ; ddof = 1 means normalising with N-1
covmat = np.cov(cod,ddof=0)
#computing eigen values and eigen vectors
eigval,eigvec = la.eig(covmat)
#multiplying eigen value and eigen vec
#for counter in range(len(eigval)):
#    eigvec[counter]= eigval[counter]*eigvec[counter]
#####################################################################################
#plotting Eigen vectors
#####################################################################################
for vec in eigvec:#fetching one vector from list of eigvecs
    #drawing the vec, basically drawing a arrow form centroid to the end point of vec
    drawvec = Arrow3D([centroid[0],vec[0]],[centroid[1],vec[1]],[centroid[2],vec[2]],mutation_scale=20,lw=3,arrowstyle="-|>",color='r')
    #adding the arrow to the plot
    ax.add_artist(drawvec)
#plot show
plt.show()
通过这种方法得到的图形不太令人满意。从两个不同的角度查看特征向量。
我原本期望得到像这样的结果。向量从重心突出以给出最大方差的方向。但似乎并没有起作用,也许特征向量没有被np.linalg正确计算?你能告诉我我错过了什么吗?
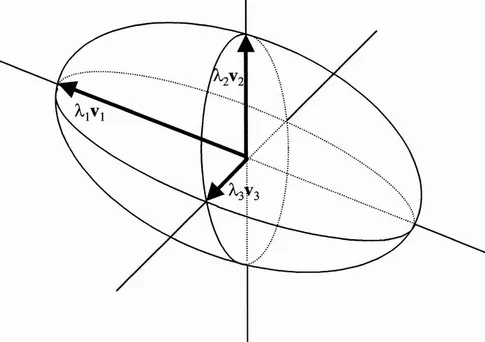
另外,我正在尝试在获得特征向量后绘制椭球体。如果您能对此提出建议,那就太好了 :)
编辑:有一些进展
我认为np.linalg只是给我特征向量相对于原点的位置向量,所以我将它们转换为相对于质心的位置向量。
#getting tuples of x,y,z
verts = [zip(xcod,ycod,zcod)]
#plotting polyhedron surface
ax.add_collection3d(Poly3DCollection(verts,alpha=0.5))
#changing eigvec from origin to centroid
for counteri in range(len(eigvec)):
    eigvec[counteri][0]+=centroid[0]
    eigvec[counteri][1]+=centroid[1]
    eigvec[counteri][2]+=centroid[2]
在进入绘图部分的
#绘制特征向量之前添加上述代码。现在我得到了类似下面的东西:
la.eig返回值的信息,我之前并不知道,numpy也没有明确说明。这应该可以解决我的问题 :) - jkhadka