Matplotlib自动缩放共享x轴图形的子图垂直高度

3

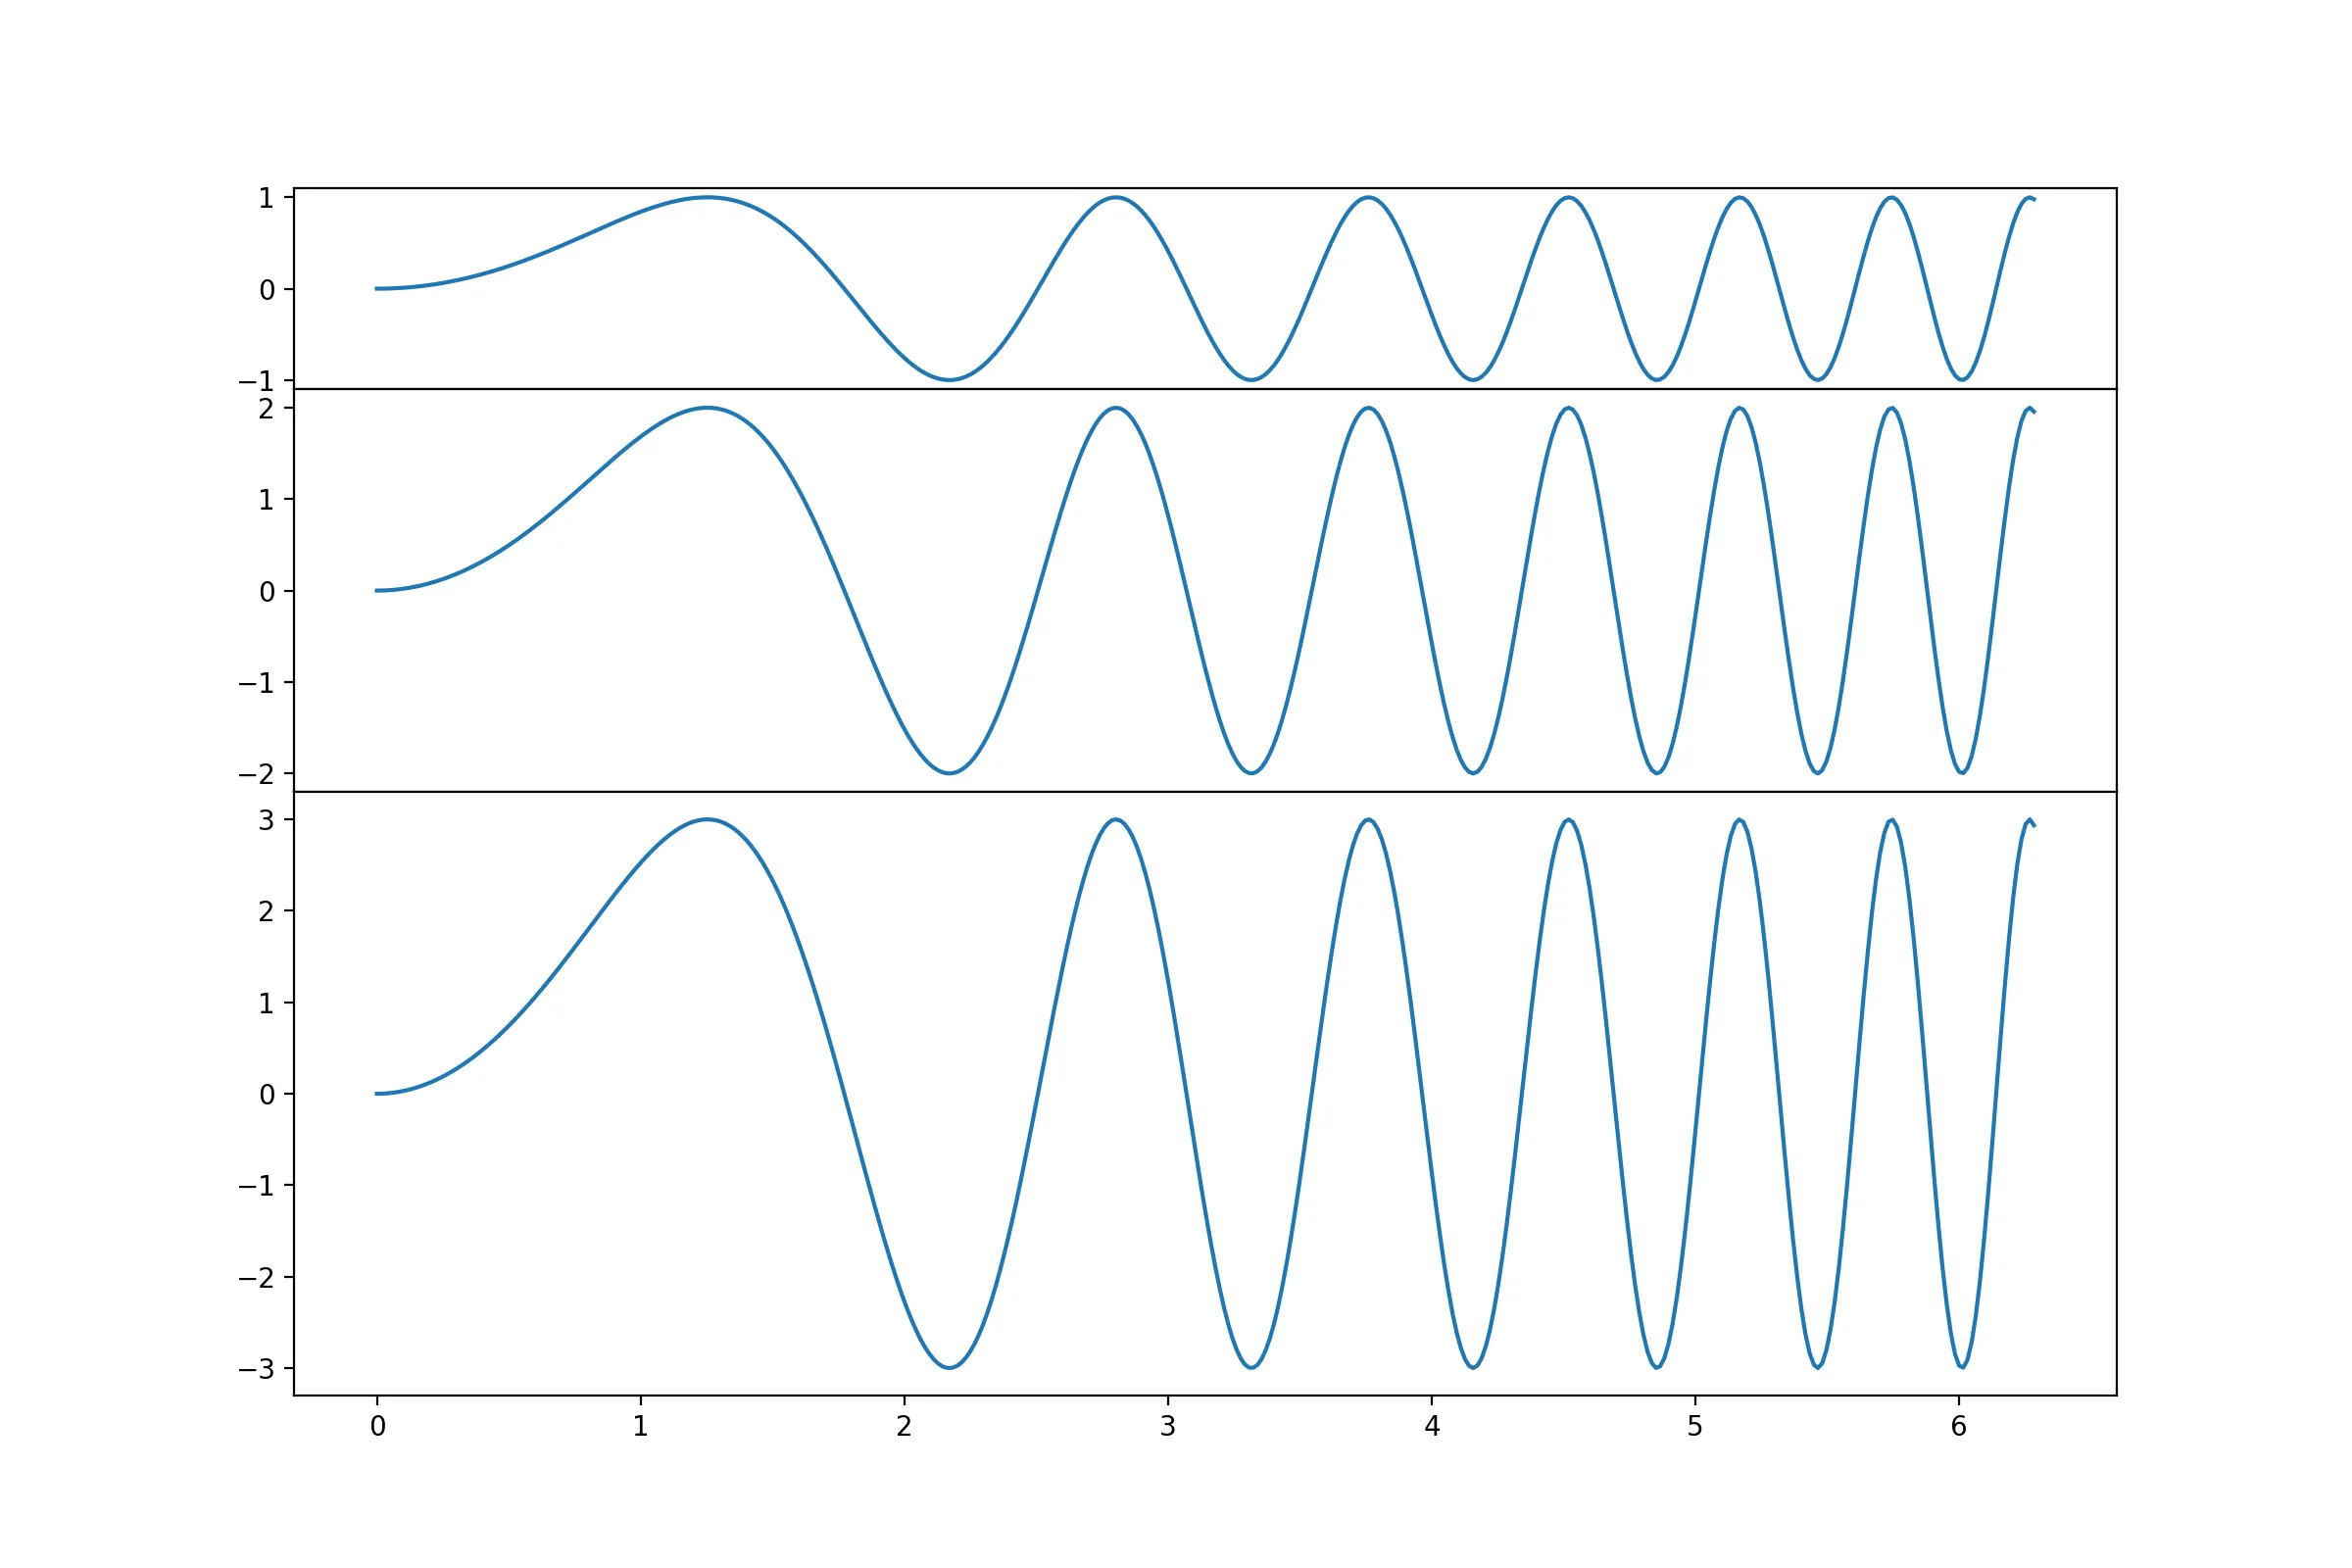
我希望能够根据数据跨度自动缩放共享x轴图形的子图的垂直高度!我想比较显示数据的相对强度。如果我在子图中使用sharey=True,则会以一种使得相对强度可识别的方式显示数据:

    import matplotlib.pyplot as plt
    from matplotlib import gridspec
    import numpy as np

    SIZE = (12, 8) #desired overall figure size


    # Simple data to display in various forms
    x = np.linspace(0, 2 * np.pi, 400)

    y = np.sin(x ** 2)
    y2 = 2*(np.sin(x ** 2))
    y3 = 3*(np.sin(x ** 2))


    fig, ax = plt.subplots(3,ncols=1, sharex=True, sharey=True)
    fig.set_size_inches(SIZE[1], SIZE[0])
    fig.subplots_adjust(hspace=0.001)


    ax[0].plot(x, y)
    ax[1].plot(x, y2)
    ax[2].plot(x, y3)
    plt.show()

现在所有子图的高度都相同,y轴上的数据跨度可以被识别,因为数据以正确的相对比例显示。我想要实现的是,每个图的刻度线应该在数据结束的地方结束,从而消除未使用的白色空间。子图的大小应该表示数据的相对高度比例。它们在Y轴上仍然应该具有相同的缩放,以便观众可以估计相对数据高度(例如可能是计数率)。
我找到了以下链接,涉及类似的问题,但没有一个真正帮助我解决我的问题: 链接1链接2
1个回答

1
这里有一个示例,可以为您确定比率并相应地创建子图:
import matplotlib.pyplot as plt
from matplotlib import gridspec
import numpy as np

SIZE = (12, 8) #desired overall figure size

# Simple data to display in various forms
x = np.linspace(0, 2 * np.pi, 400)

# the maximum multiplier for the function
N = 3

# the y-ranges:
ys = [i * np.sin(x**2) for i in range(1,N+1)]

# the maximum extent of the plot in y-direction (cast as int)
hs = [int(np.ceil(np.max(np.abs(y)))) for y in ys]

# determining the size of the GridSpec:
gs_size = np.sum(hs)
gs = gridspec.GridSpec(gs_size,1)

# the figure
fig = plt.figure(figsize = SIZE)

# creating the subplots
base = 0
ax = []
for y,h in zip(ys,hs):
    ax.append(fig.add_subplot(gs[base:h+base,:]))
    base += h
    ax[-1].plot(x,y)

##fig, ax = plt.subplots(3,ncols=1, sharex=True, sharey=True)
##fig.set_size_inches(SIZE[1], SIZE[0])
fig.subplots_adjust(hspace=0.001)


##ax[0].plot(x, ys[0])
##ax[1].plot(x, ys[1])
##ax[2].plot(x, ys[2])
plt.show()

代码确定每组数据的最大y-extend,将其转换为整数,然后使用这些extend的总和作为GridSpec的比例将图形分成子图。
生成的图形如下:

figure with subplots that scale with data extent

已在Python 3.5上测试通过。

编辑:

如果您的数据的最大值和最小值不可比较,则更改计算hs的方式可能更好。

hs = [int(np.ceil(np.max(y))) - int(np.floor(np.min(y))) for y in ys]

这回答了我的问题!谢谢!我还不确定是否完全理解,但我会尝试的 :-) - NorrinRadd
@NorrinRadd 如果你有任何特定的问题,请随时提问。 - Thomas Kühn
基本上,我正在努力改变这个公式 hs = [int(np.ceil(np.max(y))) - int(np.floor(np.min(y))) for y in ys] 以便它从我的实验数据中读取值。我在循环中填充我的轴(ax)对象,然后我有 nrows 个轴对象。我不确定如何迭代存储在此对象中的 y 值。我尝试过:hs = [int(np.ceil(np.max(y))) - int(np.floor(np.min(y))) for y in axis.get_ydata()] 但是这会导致 AttributeError: 'numpy.ndarray' object has no attribute 'get_ydata' - NorrinRadd
我使用特定的类读取数据,其中包括创建pandas dataframe的操作:data_frame = pd.DataFrame(data=data, index=index, columns=columns)。读取数据函数返回如下对象:return Data(filename, data_frame, title, path, source)。绘图函数创建的图表如下:ax.plot(self.data.index, self.data.columns,kwargs),我在主绘图脚本中循环调用它,具体次数取决于我要绘制的数据量。通常包含实验数据的列被称为“EXP”。 - NorrinRadd
创建一个能够准确反映我的问题的最小工作示例似乎非常困难。有没有一种方法可以上传两个或三个彼此相关的Python文件,让大家都可以下载?但是我猜想,如果没有最小工作示例,解决方案对于那些在这个网站上浏览类似问题的人来说也不会真正有所帮助吧?在我的情况下,我需要从当前的“axis”对象中提取数据,因为我想要能够在脚本中更改x轴范围,并相应地更新绘图以适应当前要绘制的y轴范围。我将尝试考虑一个反映这一点的最小工作示例。 - NorrinRadd
显示剩余2条评论

网页内容由stack overflow 提供, 点击上面的
可以查看英文原文,
原文链接