背景
- 同一高度的不同子图(✔)
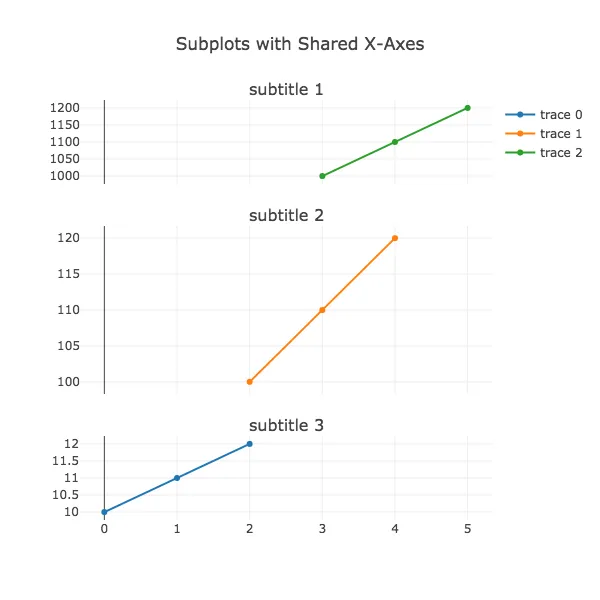
我可以创建一个带有共享X轴的子图(示例源自Plot.ly文档),子图之间具有适当的分离,并且您可以通过subplot_titles插入每个子图的特定标题:
from plotly import tools
import plotly.plotly as py
import plotly.graph_objs as go

trace1 = go.Scatter(
    x=[0, 1, 2],
    y=[10, 11, 12]
)
trace2 = go.Scatter(
    x=[2, 3, 4],
    y=[100, 110, 120],
)
trace3 = go.Scatter(
    x=[3, 4, 5],
    y=[1000, 1100, 1200],
)
fig = tools.make_subplots(rows=3, cols=1, specs=[[{}], [{}], [{}]],
                          shared_xaxes=True, shared_yaxes=True,
                          vertical_spacing=0.1, subplot_titles=('subtitle 1',
                          'subtitle 2', 'subtitle 3'))
fig.append_trace(trace1, 3, 1)
fig.append_trace(trace2, 2, 1)
fig.append_trace(trace3, 1, 1)

fig['layout'].update(height=600, width=600, title='Subplots with Shared X-Axes')
py.plot(fig, filename='subplots-shared-xaxes')
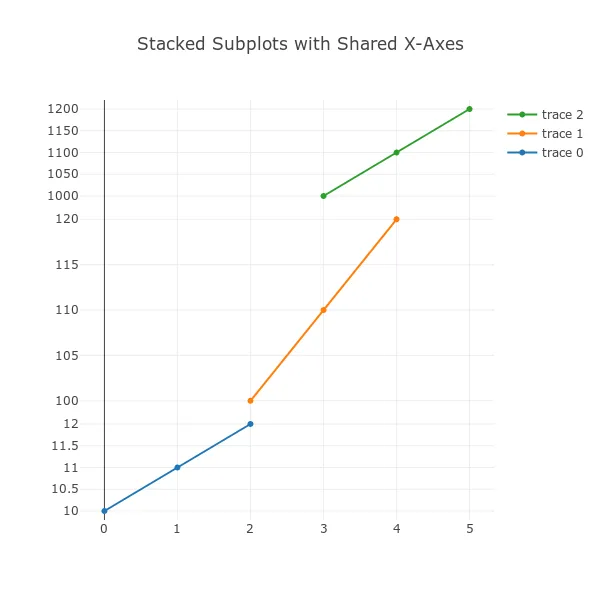
- 合并不同高度的子图(✘),使用具有不同高度的子图(✔)
我还可以创建一个带有共享X轴的堆叠子图(示例源自Plot.ly文档),您可以通过domain定义每个子图的相对高度:
from plotly import tools
import plotly.plotly as py
import plotly.graph_objs as go

trace1 = go.Scatter(
    x=[0, 1, 2],
    y=[10, 11, 12]
)
trace2 = go.Scatter(
    x=[2, 3, 4],
    y=[100, 110, 120],
    yaxis='y2'
)
trace3 = go.Scatter(
    x=[3, 4, 5],
    y=[1000, 1100, 1200],
    yaxis='y3'
)
data = [trace1, trace2, trace3]
layout = go.Layout(
    yaxis=dict(
        domain=[0, 0.25]
    ),
    legend=dict(
        traceorder='reversed'
    ),
    yaxis2=dict(
        domain=[0.25, 0.75]
    ),
    yaxis3=dict(
        domain=[0.75, 1]
    )
)
fig = go.Figure(data=data, layout=layout)
fig['layout'].update(height=600, width=600, title='Stacked Subplots with Shared X-Axes')
py.plot(fig, filename='stacked-subplots-shared-x-axis')
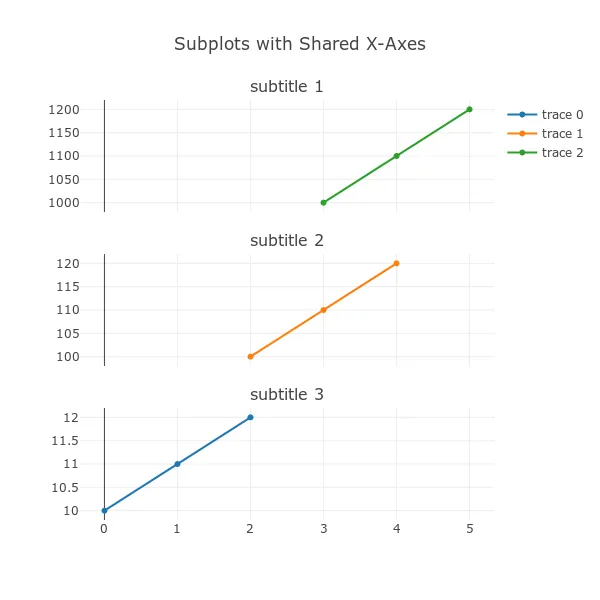
问题
如何创建共享x轴的子图,并且每个子图都有不同相对高度和标题(图1)(图2)?
我尝试过的
- 使用subplots和rowspan
第一个方法是创建一行,使绘制跨越两行:
from plotly import tools
import plotly.plotly as py
import plotly.graph_objs as go

trace1 = go.Scatter(
    x=[0, 1, 2],
    y=[10, 11, 12]
)
trace2 = go.Scatter(
    x=[2, 3, 4],
    y=[100, 110, 120],
)
trace3 = go.Scatter(
    x=[3, 4, 5],
    y=[1000, 1100, 1200],
)
fig = tools.make_subplots(
    rows=4,
    cols=1,
    specs=[
        [{}],
        [{'rowspan':2}],
        [None],
        [{}],
    ],
    shared_xaxes=True,
    shared_yaxes=True,
    vertical_spacing=0.1,
    subplot_titles=(
        'subtitle 1',
        'subtitle 2',
        None,
        'subtitle 3',
    )
)
fig.append_trace(trace3, 1, 1)
fig.append_trace(trace2, 2, 1)
fig.append_trace(trace1, 4, 1)

fig['layout'].update(height=600, width=600, title='Subplots with Shared X-Axes, span rows')
py.plot(fig, filename='subplots-shared-x-axis-span-rows', auto_open=True)
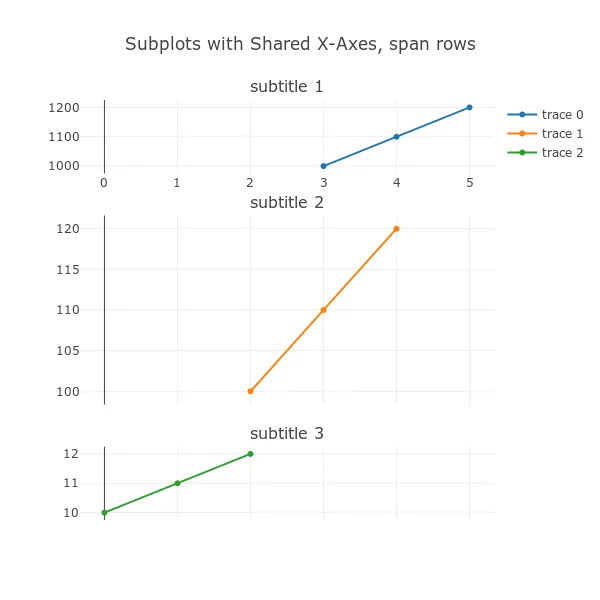
结果正是我想要达到的目标。 然而,这种方法在语法上似乎有点错误:我不想要跨越两行的图形。此外,必须将[None]添加到specs和None添加到subplot_titles中,如果您想修改任何内容,这样做既丑陋又容易出错。
还考虑这样一种情况:您想要一个子图高度分布为13% | 70% | 17%!
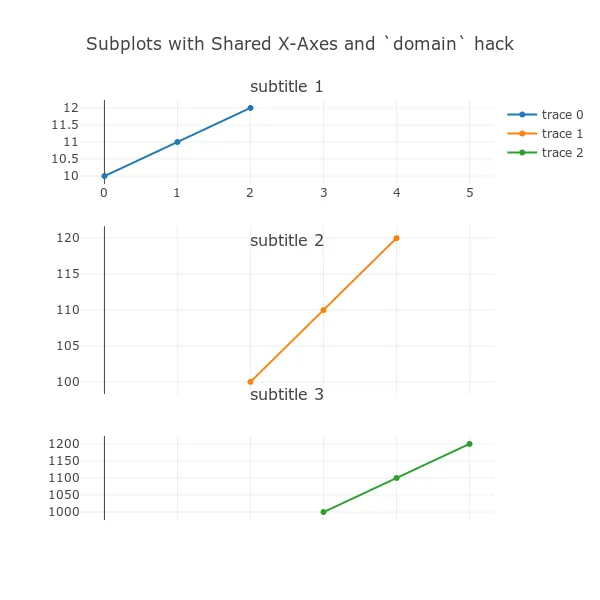
- 使用
domain
一种稍微好一些的选择是使用domain更新轴,但子图标题会混乱(它们仍然均匀垂直分布):
from plotly import tools
import plotly.plotly as py
import plotly.graph_objs as go

trace1 = go.Scatter(
    x=[0, 1, 2],
    y=[10, 11, 12]
)
trace2 = go.Scatter(
    x=[2, 3, 4],
    y=[100, 110, 120],
)
trace3 = go.Scatter(
    x=[3, 4, 5],
    y=[1000, 1100, 1200],
)
fig = tools.make_subplots(
    rows=3,
    cols=1,
    specs=[[{}], [{}], [{}]],
    shared_xaxes=True,
    shared_yaxes=True,
    vertical_spacing=0.1,
    subplot_titles=(
        'subtitle 1',
        'subtitle 2',
        'subtitle 3'
    )
)
fig.append_trace(trace1, 3, 1)
fig.append_trace(trace2, 2, 1)
fig.append_trace(trace3, 1, 1)

fig['layout'].update(height=600, width=600, title='Subplots with Shared X-Axes and `domain` hack')
fig['layout']['yaxis1'].update(domain=[0, 0.2])
fig['layout']['yaxis2'].update(domain=[0.3, 0.7])
fig['layout']['yaxis3'].update(domain=[0.8, 1])
py.plot(fig, filename='subplots-shared-x-axis-domain-hack', auto_open=True)