matplotlib:如果我设置图形高度,X轴图例会被裁剪

4
我正在尝试使用fig1.set_size_inches(5.5,3)来设置Python中的图形大小,但绘制出的图形中x标签不完全可见。图形本身具有我需要的大小,但似乎内部的坐标轴太高了,而x标签就再也无法适应了。
这是我的代码:
fig1 = plt.figure()
fig1.set_size_inches(5.5,4)
fig1.set_dpi(300)
ax = fig1.add_subplot(111)
ax.grid(True,which='both')
ax.hist(driveDistance,100)
ax.set_xlabel('Driven Distance in km')
ax.set_ylabel('Frequency')
fig1.savefig('figure1_distance.png')

以下是结果文件:

5.5x3英寸的图片

2个回答

9

您可以要求保存方法考虑x轴标签的艺术家。

这可以使用bbox_extra_artists和tight layout完成。 相应代码如下:

import matplotlib.pyplot as plt
fig1 = plt.figure()
fig1.set_size_inches(5.5,4)
fig1.set_dpi(300)
ax = fig1.add_subplot(111)
ax.grid(True,which='both')
ax.hist(driveDistance,100)
xlabel = ax.set_xlabel('Driven Distance in km')
ax.set_ylabel('Frequency')
fig1.savefig('figure1_distance.png', bbox_extra_artists=[xlabel], bbox_inches='tight')

3
使用子图时,您可以使用
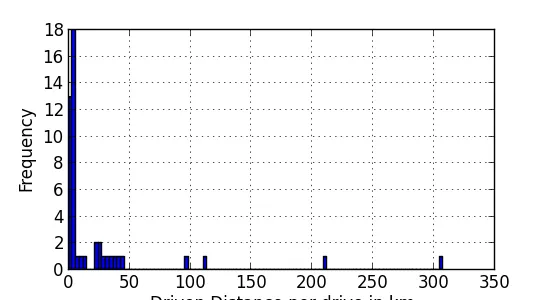
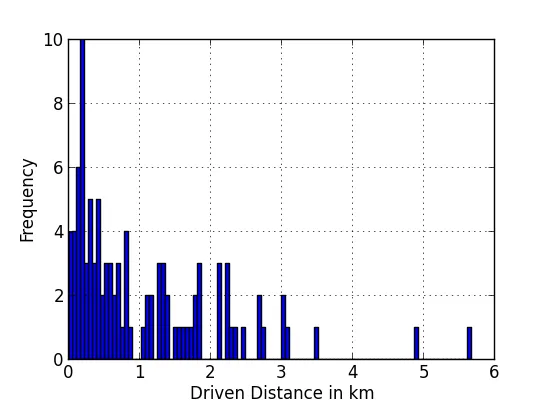
fig1.tight_layout()而不是bbox_inches='tight'来使图像更加紧凑。 - Francesco Montesano
只指定bbox_inches='tight'就解决了我的标签截断问题,谢谢! - ecoe
4
实际上,变量 xlabel 可能不是必需的。只需将代码的最后一行更改为 fig1.savefig('figure1_distance.png', bbox_inches='tight') 即可完成工作。 - Chris.Q
如果我将fig.tight_layout()放在最后,也就是在定义所有坐标轴标签之后,它对我起作用。 - Francisco C

2

如果我使用figsizedpi作为kwargs来初始化图形,它对我有效:

from numpy import random
from matplotlib import pyplot as plt
driveDistance = random.exponential(size=100)
fig1 = plt.figure(figsize=(5.5,4),dpi=300)
ax = fig1.add_subplot(111)
ax.grid(True,which='both')
ax.hist(driveDistance,100)
ax.set_xlabel('Driven Distance in km')
ax.set_ylabel('Frequency')
fig1.savefig('figure1_distance.png')

driveDistance


1
它对我没用……和之前一样的结果。@Tal的答案完美地解决了问题。感谢你的帮助! - otmezger
可能是后端问题,我正在使用MacOSX。无论如何,至少你知道你可以从一开始就选择图形大小和dpi :) - askewchan
当然,我也采用了代码的这一部分。我也在运行Mac OS X,Python 2.7.3版本。 - otmezger

网页内容由stack overflow 提供, 点击上面的
可以查看英文原文,
原文链接