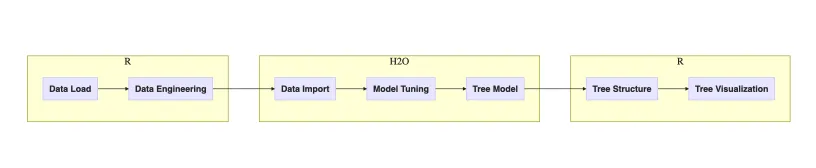
寻找一种有效的方法,在rstudio、H2O的Flow或本地html页面中绘制树,类似于下面链接中图片所示的h2o的RF和GBM模型。 具体来说,如何为下面代码生成的对象(已拟合模型)rf1和gbm2绘制树,也许是通过解析h2o.download_pojo(rf1)或h2o.download_pojo(gbm1)实现的?

# # The following two commands remove any previously installed H2O packages for R.
# if ("package:h2o" %in% search()) { detach("package:h2o", unload=TRUE) }
# if ("h2o" %in% rownames(installed.packages())) { remove.packages("h2o") }

# # Next, we download packages that H2O depends on.
# pkgs <- c("methods","statmod","stats","graphics","RCurl","jsonlite","tools","utils")
# for (pkg in pkgs) {
#   if (! (pkg %in% rownames(installed.packages()))) { install.packages(pkg) }
# }
#
# # Now we download, install h2o package
# install.packages("h2o", type="source", repos=(c("http://h2o-release.s3.amazonaws.com/h2o/rel-turchin/3/R")))
library(h2o)

h2o.init(nthreads = -1, max_mem_size = "2G")
h2o.removeAll()  ##clean slate - just in case the cluster was already running

## Load data - available to download from link below
## https://www.dropbox.com/s/gu8e2o0mzlozbu4/SampleData.csv?dl=0
df <- h2o.importFile(path = normalizePath("../SampleData.csv"))

splits <- h2o.splitFrame(df, c(0.4, 0.3), seed = 1234)

train <- h2o.assign(splits[[1]], "train.hex")
valid <- h2o.assign(splits[[2]], "valid.hex")
test <- h2o.assign(splits[[2]], "test.hex")

predictor_col_start_pos <- 2
predictor_col_end_pos <- 169
predicted_col_pos <- 1

rf1 <- h2o.randomForest(training_frame = train, validation_frame = valid,
                        x = predictor_col_start_pos:predictor_col_end_pos, y = predicted_col_pos,
                        model_id = "rf_covType_v1", ntrees = 2000, stopping_rounds = 10, score_each_iteration = T,
                        seed = 2001)

gbm1 <- h2o.gbm(training_frame = train, validation_frame = valid, x = predictor_col_start_pos:predictor_col_end_pos,
            y = predicted_col_pos, model_id = "gbm_covType2", seed = 2002, ntrees = 20,
            learn_rate = 0.2, max_depth = 10, stopping_rounds = 2, stopping_tolerance = 0.01,
            score_each_iteration = T)


## Next step would be to plot trees for fitted models rf1 and gbm2
# print the model, POJO (Plain Old Java Object) to screen
h2o.download_pojo(rf1)
h2o.download_pojo(gbm1)