使用Scikit-Learn在Python中为随机森林绘制决策树。

36
我想绘制一个随机森林的决策树。因此,我编写了以下代码:

我想绘制一个随机森林的决策树。因此,我编写了以下代码:

clf = RandomForestClassifier(n_estimators=100)
import pydotplus
import six
from sklearn import tree
dotfile = six.StringIO()
i_tree = 0
for tree_in_forest in clf.estimators_:
if (i_tree <1):        
    tree.export_graphviz(tree_in_forest, out_file=dotfile)
    pydotplus.graph_from_dot_data(dotfile.getvalue()).write_png('dtree'+ str(i_tree) +'.png')
    i_tree = i_tree + 1

但它并没有生成任何东西.. 你有想法如何从随机森林中绘制决策树吗?
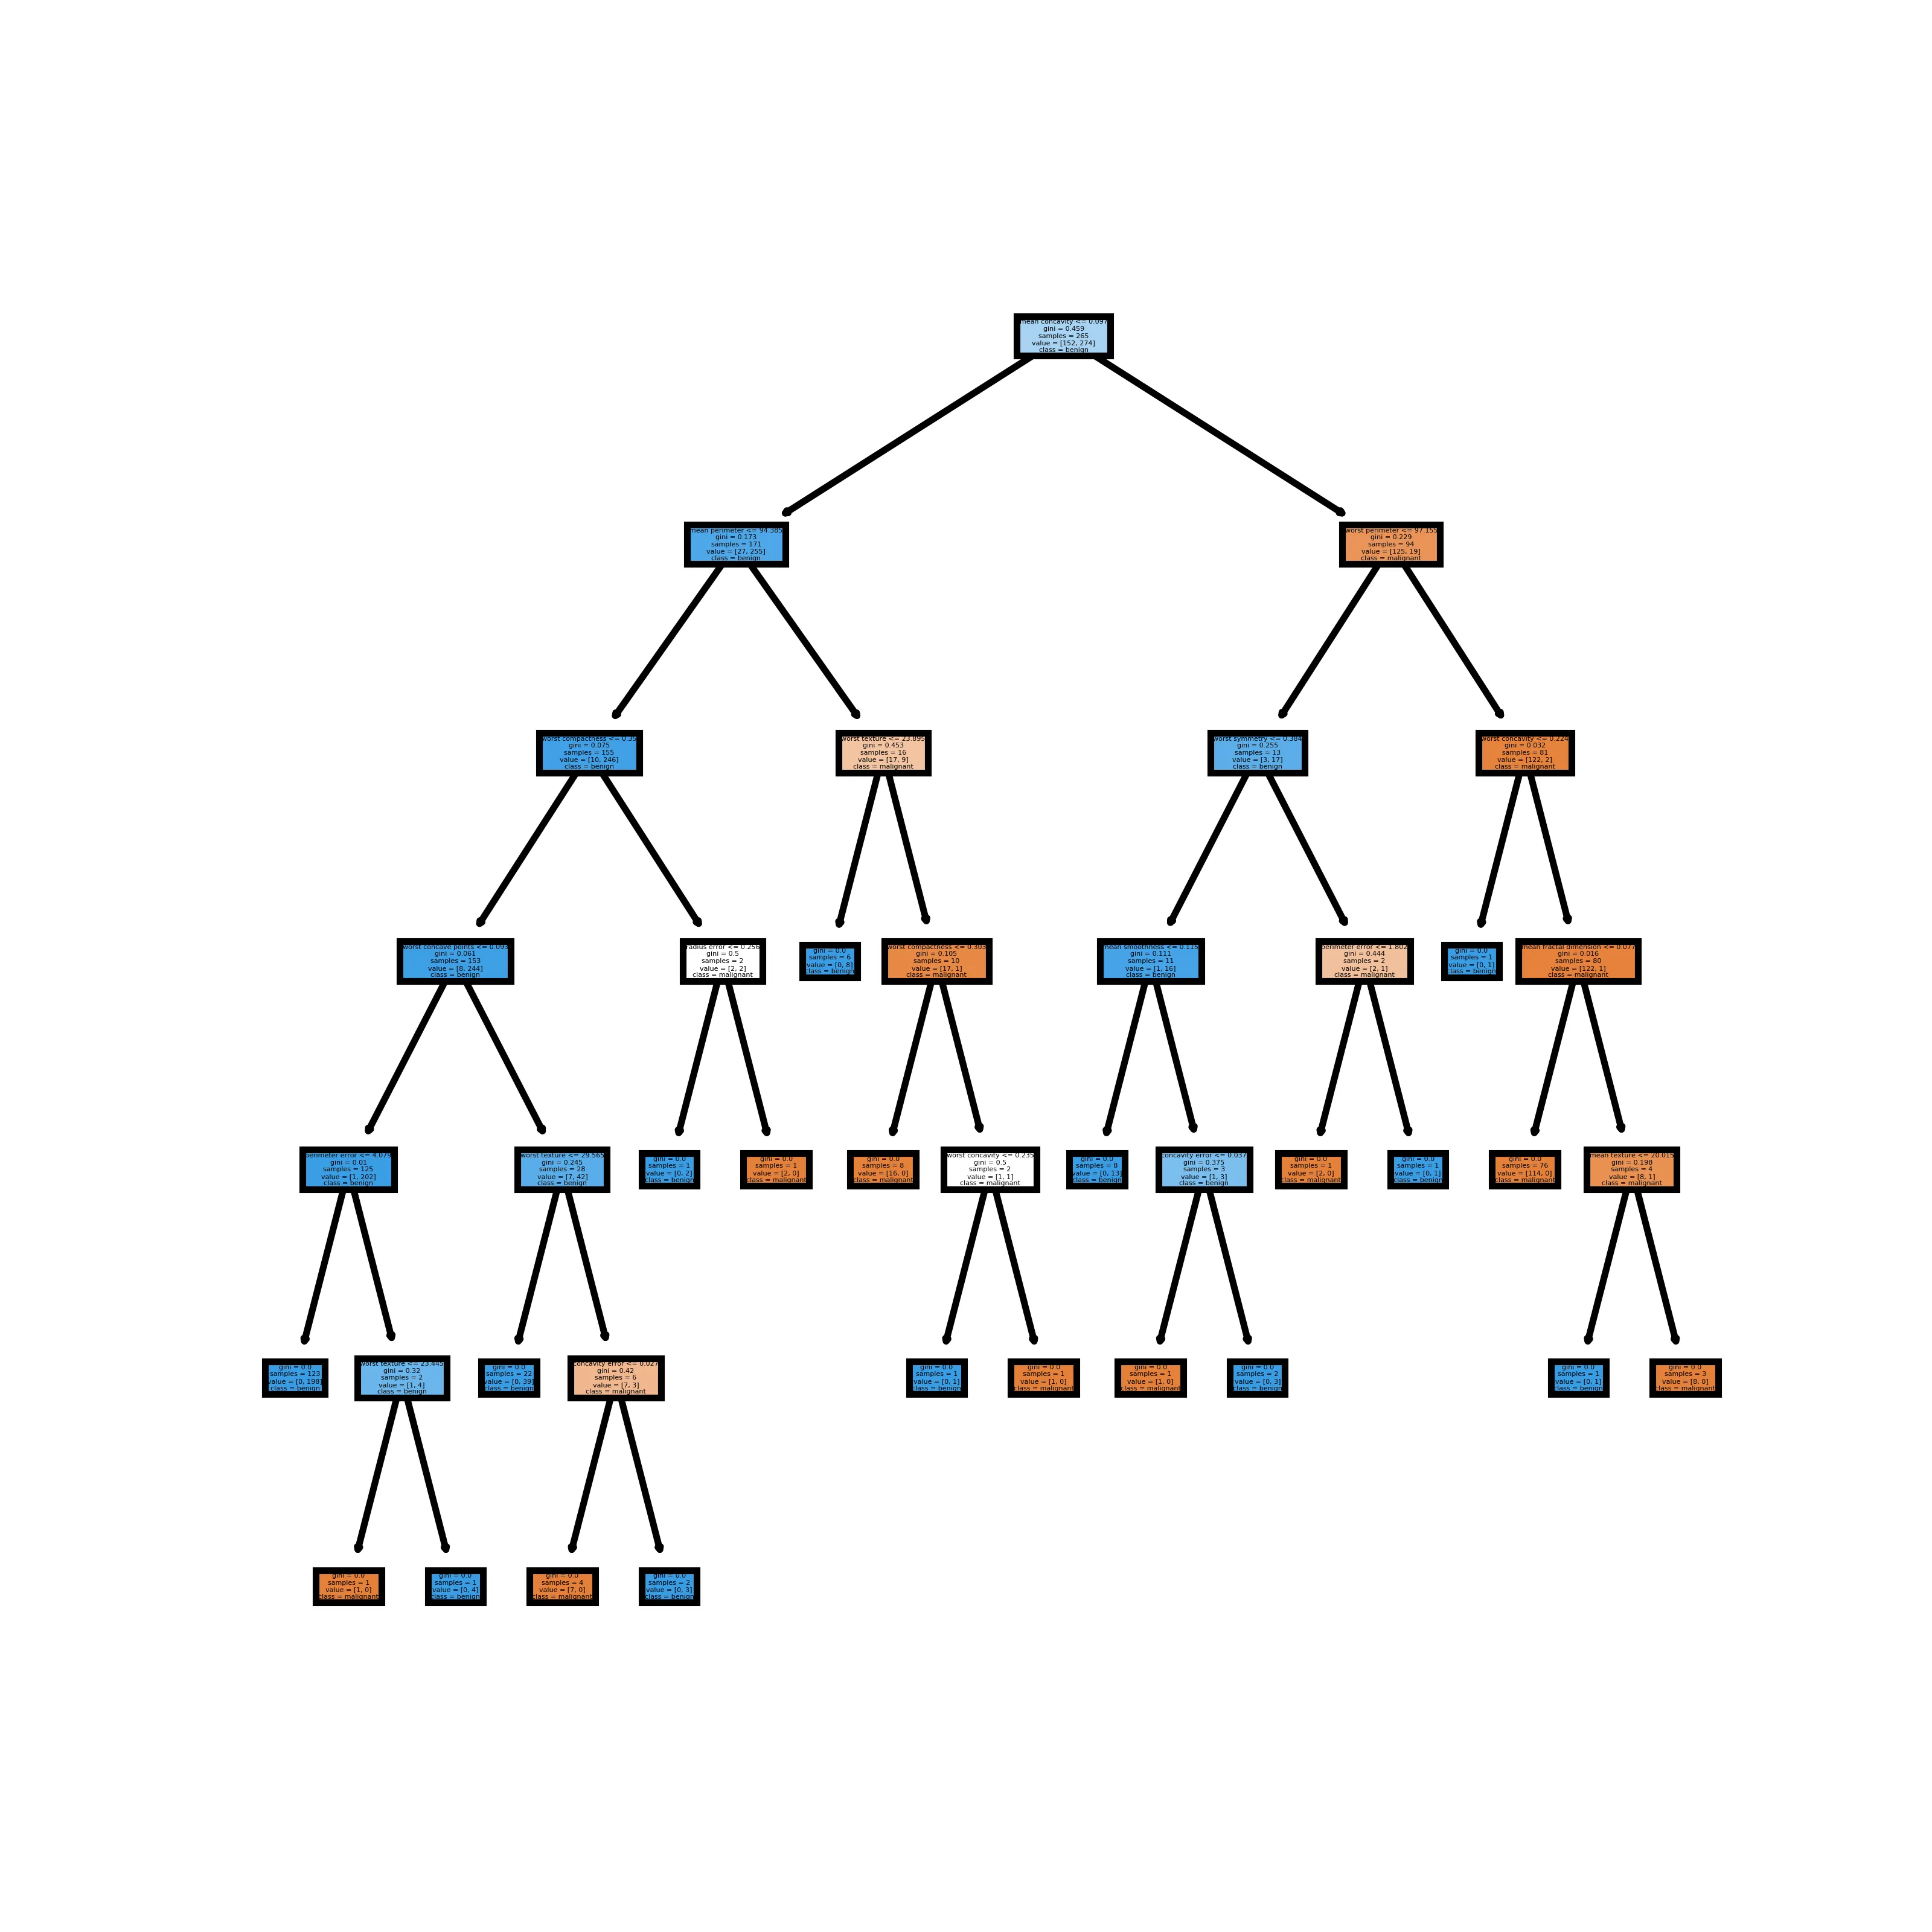
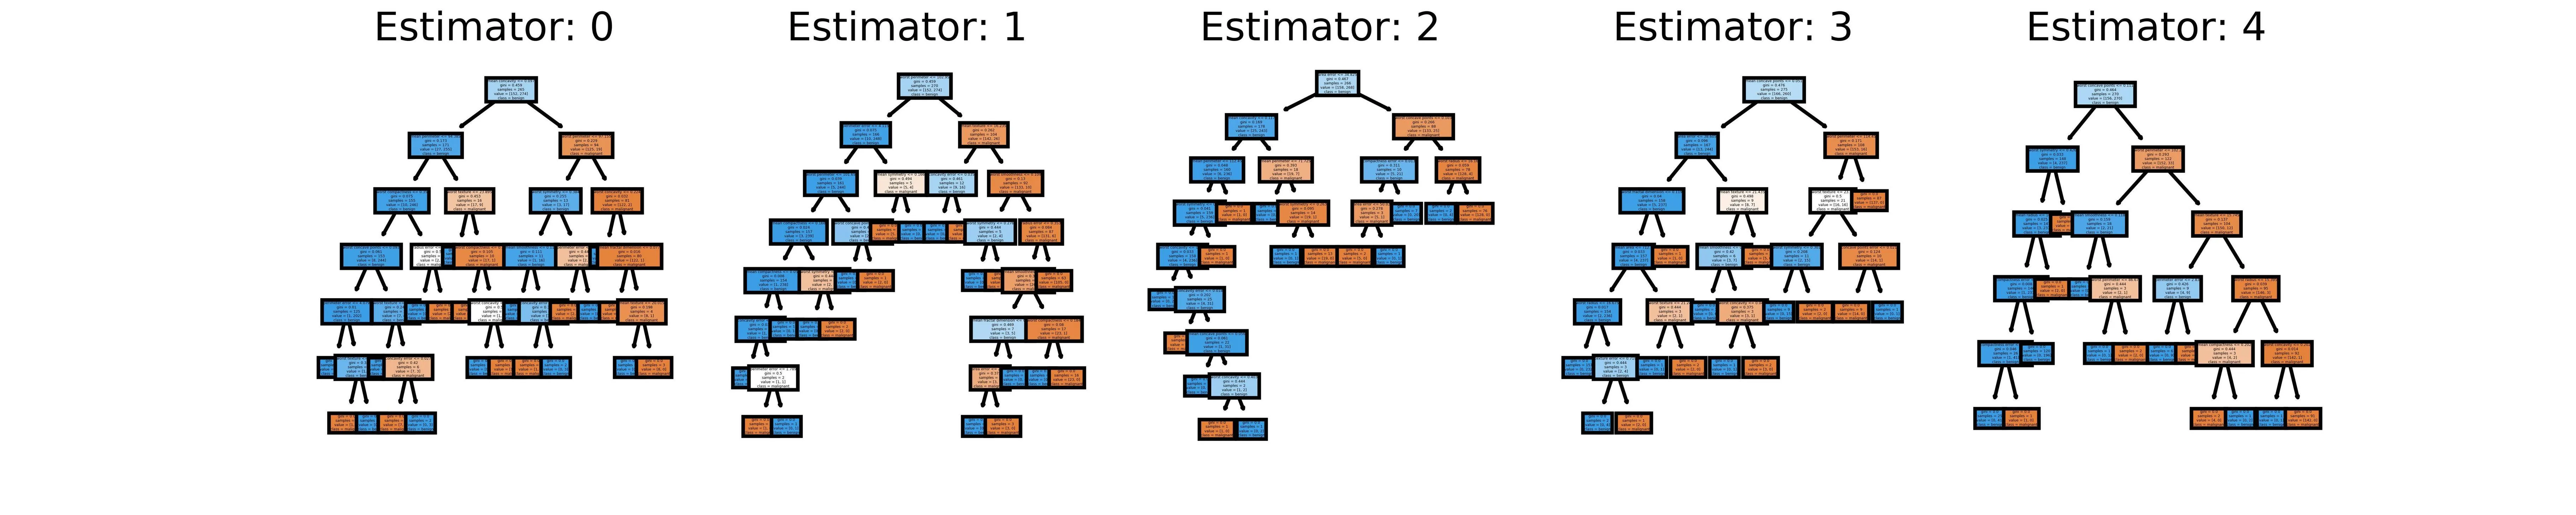
6个回答

43
假设您的随机森林模型已经适合好了,首先需要导入export_graphviz函数:
from sklearn.tree import export_graphviz

在您的 for 循环中,您可以执行以下操作以生成 dot 文件。
export_graphviz(tree_in_forest,
                feature_names=X.columns,
                filled=True,
                rounded=True)

下一行生成一个 png 文件。
os.system('dot -Tpng tree.dot -o tree.png')

我认为随机森林中没有树的属性,是吗? - LKM
19
@LKM,随机森林是一组树的列表。您可以使用“estimators_”属性获取该列表。例如,您可以使用“random_forest.estimators_[0]”导出第一棵树。 - Ricardo Magalhães Cruz
"export_graphviz" 只能用于决策树,而不能用于随机森林。 - abutaleb haidary
@LKM 一棵树是列表 clf.estimators_ 的一个元素。 - user6903745
len(random_forest.estimators_) 给出了树的数量。 - ABCD

40

在scikit-learn中拟合随机森林模型之后,您可以可视化来自随机森林的单个决策树。以下代码首先拟合了一个随机森林模型。

import matplotlib.pyplot as plt
from sklearn.datasets import load_breast_cancer
from sklearn import tree
import pandas as pd
from sklearn.ensemble import RandomForestClassifier
from sklearn.model_selection import train_test_split

# Load the Breast Cancer Dataset
data = load_breast_cancer()
df = pd.DataFrame(data.data, columns=data.feature_names)
df['target'] = data.target

# Arrange Data into Features Matrix and Target Vector
X = df.loc[:, df.columns != 'target']
y = df.loc[:, 'target'].values

# Split the data into training and testing sets
X_train, X_test, Y_train, Y_test = train_test_split(X, y, random_state=0)

# Random Forests in `scikit-learn` (with N = 100)
rf = RandomForestClassifier(n_estimators=100,
                            random_state=0)
rf.fit(X_train, Y_train)

现在您可以可视化单个决策树。以下代码可视化第一棵决策树。

fn=data.feature_names
cn=data.target_names
fig, axes = plt.subplots(nrows = 1,ncols = 1,figsize = (4,4), dpi=800)
tree.plot_tree(rf.estimators_[0],
               feature_names = fn, 
               class_names=cn,
               filled = True);
fig.savefig('rf_individualtree.png')

下面的图片是被保存的内容。

enter image description here

因为这个问题涉及到树,如果您愿意,可以将随机森林中的所有估算器(决策树)可视化。下面的代码可视化了上面拟合的随机森林模型的前5个。

# This may not the best way to view each estimator as it is small
fn=data.feature_names
cn=data.target_names
fig, axes = plt.subplots(nrows = 1,ncols = 5,figsize = (10,2), dpi=900)
for index in range(0, 5):
    tree.plot_tree(rf.estimators_[index],
                   feature_names = fn, 
                   class_names=cn,
                   filled = True,
                   ax = axes[index]);

    axes[index].set_title('Estimator: ' + str(index), fontsize = 11)
fig.savefig('rf_5trees.png')

下面的图片是已保存的内容。

enter image description here

这段代码是从这篇文章中改编而来的。


5

要从scikit-learn的随机森林访问单个决策树,请使用estimators_属性:

rf = RandomForestClassifier()
# first decision tree
rf.estimators_[0]

然后您可以使用标准方法可视化决策树:

  • 您可以使用sklearn的export_text打印树形表示
  • 将其导出到Graphviz并使用sklearn的export_graphviz方法绘制
  • 使用sklearn的plot_tree方法在matplotlib中绘制
  • 使用dtreeviz软件包进行树形图绘制

有关示例输出的代码说明,请参见此文章

在绘制来自随机森林的单个决策树时需要注意的重要事项是,它可能已完全生成(默认超参数)。这意味着树可能非常深。对我而言,深度大于6的树非常难以阅读。因此,如果需要树形可视化,则使用max_depth < 7构建随机森林。您可以在此文章中检查示例可视化效果。


1
你可以像这样查看每棵树,
i_tree = 0
for tree_in_forest in FT_cls_gini.estimators_:
    if (i_tree ==3):        
        tree.export_graphviz(tree_in_forest, out_file=dotfile)
        graph = pydotplus.graph_from_dot_data(dotfile.getvalue())        
    i_tree = i_tree + 1
Image(graph.create_png())

你能否添加更多的解释,说明这个答案与其他答案有何不同?仅仅倾泻代码并不是最好的方式。 - razdi

0
你可以绘制一棵单独的树:
from sklearn.tree import export_graphviz
from IPython import display
from sklearn.ensemble import RandomForestRegressor

m = RandomForestRegressor(n_estimators=1, max_depth=3, bootstrap=False, n_jobs=-1)
m.fit(X_train, y_train)

str_tree = export_graphviz(m, 
   out_file=None, 
   feature_names=X_train.columns, # column names
   filled=True,        
   special_characters=True, 
   rotate=True, 
   precision=0.6)

display.display(str_tree)

1
你知道“draw_tree”函数中的参数ratio和precision是什么意思吗? - ozo
1
这个方法已经不再适用了,因为.structured包已经从库中删除。 - Philipp

-1
除了上面提供的解决方案,你也可以尝试这个(希望对未来可能需要的人有所帮助)。
from sklearn.tree import export_graphviz
from six import StringIO 

i_tree = 0
dot_data = StringIO()
for tree_in_forest in rfc.estimators_:#rfc random forest classifier
    if (i_tree ==3):        
        export_graphviz(tree_in_forest, out_file=dot_data)
        graph = pydotplus.graph_from_dot_data(dot_data.getvalue())        
    i_tree = i_tree + 1
Image(graph.create_png())

网页内容由stack overflow 提供, 点击上面的
可以查看英文原文,
原文链接