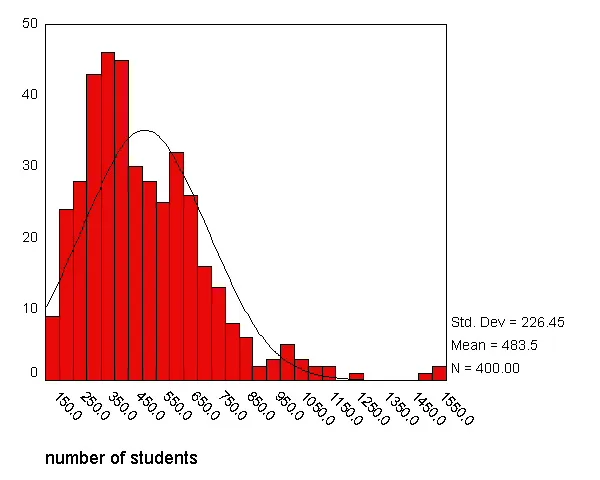
你好,我想用Python和Pandas绘制一个直方图,直方图的顶部需要显示Q1、Q2、Q3以及异常值的箱形图。如下所示:

我查看了几个使用matplotlib.pyplot的示例,但很少有好的示例。我还希望像下面的图片一样,直方图曲线也能够出现。
我也尝试了seaborn,它提供了与直方图相结合的形状线,但是没有找到将其与上面的箱形图结合起来的方法。
有人能够帮助我在 matplotlib.pyplot 或使用pyplot 中实现此功能吗?
你好,我想用Python和Pandas绘制一个直方图,直方图的顶部需要显示Q1、Q2、Q3以及异常值的箱形图。如下所示:
我查看了几个使用matplotlib.pyplot的示例,但很少有好的示例。我还希望像下面的图片一样,直方图曲线也能够出现。
我也尝试了seaborn,它提供了与直方图相结合的形状线,但是没有找到将其与上面的箱形图结合起来的方法。
有人能够帮助我在 matplotlib.pyplot 或使用pyplot 中实现此功能吗?
import numpy as np
import seaborn as sns
import matplotlib.pyplot as plt

sns.set(style="ticks")

x = np.random.randn(100)

f, (ax_box, ax_hist) = plt.subplots(2, sharex=True,
                                    gridspec_kw={"height_ratios": (.15, .85)})

sns.boxplot(x, ax=ax_box)
sns.distplot(x, ax=ax_hist)

ax_box.set(yticks=[])
sns.despine(ax=ax_hist)
sns.despine(ax=ax_box, left=True)
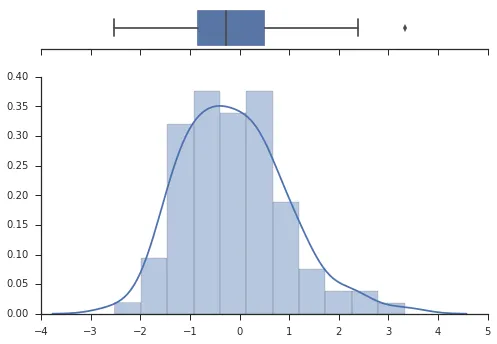
从 seaborn v0.11.2 开始,sns.distplot 已被弃用。请改用 sns.histplot 来绘制轴级图表。
np.random.seed(2022)
x = np.random.randn(100)

f, (ax_box, ax_hist) = plt.subplots(2, sharex=True, gridspec_kw={"height_ratios": (.15, .85)})

sns.boxplot(x=x, ax=ax_box)
sns.histplot(x=x, bins=12, kde=True, stat='density', ax=ax_hist)

ax_box.set(yticks=[])
sns.despine(ax=ax_hist)
sns.despine(ax=ax_box, left=True)
只使用matplotlib的解决方案,仅仅因为它:
# start the plot: 2 rows, because we want the boxplot on the first row
# and the hist on the second
fig, ax = plt.subplots(
    2, figsize=(7, 5), sharex=True,
    gridspec_kw={"height_ratios": (.3, .7)}  # the boxplot gets 30% of the vertical space
)

# the boxplot
ax[0].boxplot(data, vert=False)

# removing borders
ax[0].spines['top'].set_visible(False)
ax[0].spines['right'].set_visible(False)
ax[0].spines['left'].set_visible(False)

# the histogram
ax[1].hist(data)

# and we are good to go
plt.show()
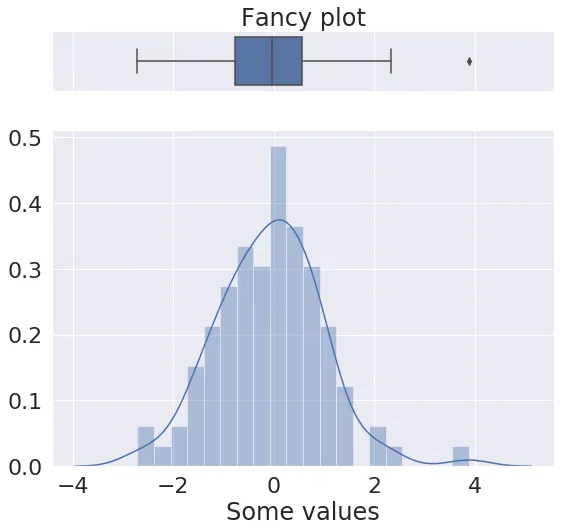
在@mwaskom的回答基础上,我编写了一个可适应的小型函数。
import seaborn as sns
def histogram_boxplot(data, xlabel = None, title = None, font_scale=2, figsize=(9,8), bins = None):
    """ Boxplot and histogram combined
    data: 1-d data array
    xlabel: xlabel
    title: title
    font_scale: the scale of the font (default 2)
    figsize: size of fig (default (9,8))
    bins: number of bins (default None / auto)

    example use: histogram_boxplot(np.random.rand(100), bins = 20, title="Fancy plot")
    """

    sns.set(font_scale=font_scale)
    f2, (ax_box2, ax_hist2) = plt.subplots(2, sharex=True, gridspec_kw={"height_ratios": (.15, .85)}, figsize=figsize)
    sns.boxplot(data, ax=ax_box2)
    sns.distplot(data, ax=ax_hist2, bins=bins) if bins else sns.distplot(data, ax=ax_hist2)
    if xlabel: ax_hist2.set(xlabel=xlabel)
    if title: ax_box2.set(title=title)
    plt.show()

histogram_boxplot(np.random.randn(100), bins = 20, title="Fancy plot", xlabel="Some values")
def histogram_boxplot(feature, figsize=(15,10), bins=None):
    f,(ax_box,ax_hist)=plt.subplots(nrows=2,sharex=True, gridspec_kw={'height_ratios':(.25,.75)},figsize=figsize)

    sns.distplot(feature,kde=False,ax=ax_hist,bins=bins)
    sns.boxplot(feature,ax=ax_box, color='Red')
    ax_hist.axvline(np.mean(feature),color='g',linestyle='-')
    ax_hist.axvline(np.median(feature),color='y',linestyle='--')