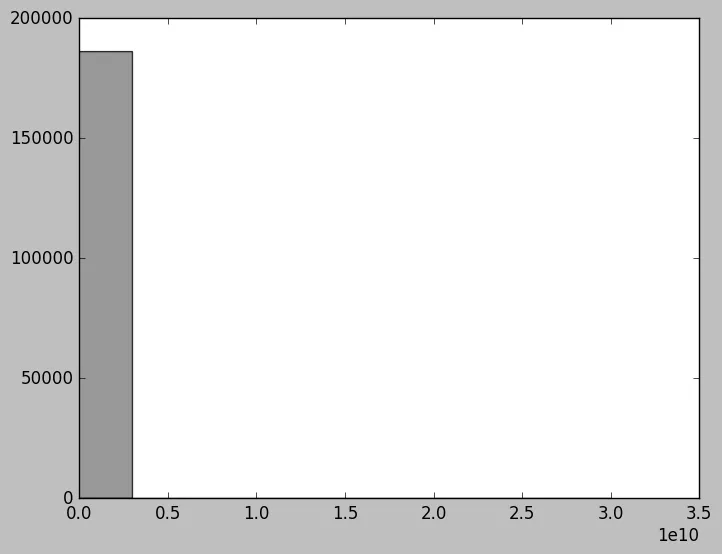
我的数据——从pandas dataframe中提取出的196,585条numpy数组记录,正在被matplotlib.hist放入单个箱子中。这些数据最初是整数,因此我试图将它们转换为浮点数,如下所示,但它们仍未在10个bin之间分配。
有趣的是,整数数据的一个小子样本(使用df.sample(0.00x))成功地分布。
如果你对数据准备或使用matplotlib的直方图函数有任何建议,我将不胜感激。
x = df[(df['UNIT']=='X')].OPP_VALUE.values
num_bins = 10
n, bins, patches = plt.hist((x[(x>0)]).astype(float), num_bins, normed=False, facecolor='0.5', alpha=0.8)
plt.show()
log=True- 您的样本包含很少的大值,这会扭曲分布。您可能需要考虑将它们删除。 - celprint(n); print(bins);的输出吗? - Mad Physicist